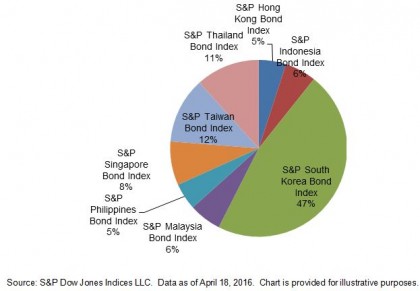
According to the S&P Pan Asia Bond Index, India and China together represented 79% of the overall market value as of April 18, 2016. While foreign investor access to these countries is opening up, the investability is still limited. The market value excluding these two countries is around USD 2 trillion, as tracked by the S&P Pan Asia Ex China and India Bond Index, and Korea has the biggest exposure (see Exhibit 1).
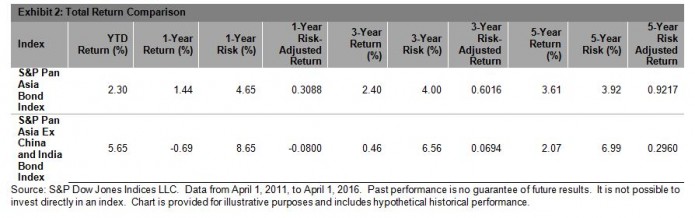
Looking at historical performances, the S&P Pan Asia Bond Index outperformed the S&P Pan Asia Ex China and India Bond Index over the past one-, three-, and five-year periods, reflected the robust returns in the Indian and Chinese markets in recent years. However, the trend has been reversing in 2016 and the S&P Pan Asia Ex China and India Bond Index increased 5.65% YTD, as of April 1, 2016. Interestingly, the S&P Pan Asia Ex China and India Bond Index also demonstrated higher volatility in the past 5 years (see Exhibit 2).
Exhibit 1: Country Breakdown of the S&P Pan Asia Ex China and India Bond Index
The posts on this blog are opinions, not advice. Please read our Disclaimers.