Get Indexology® Blog updates via email.

In This List

Details of the Two-Factor Model

2015 - The Year of Hope and Despair for the India Market

Election Year 2016: Will A Republican President Help Oil?

Asian Fixed Income: Southeast Asian Bond Markets

Seven Commodities To Love

Details of the Two-Factor Model

Contributor Image
Hong Xie

Former Senior Director, Global Research & Design

S&P Dow Jones Indices

After identifying value and low volatility as factors that can effectively explain the return and volatility of an investment-grade corporate bond portfolio, we proposed a two-factor model to capture the security selection process of active corporate bond managers.

The underlying universe for our study is the S&P U.S Issued Investment Grade Corporate Bond Index from June 30, 2006, through Aug. 31, 2015.  To enhance the liquidity profile and tradability of the index portfolio, we first derived an investable subuniverse, applying seasoning and outstanding amount as criteria.  Of that investable subuniverse, the bonds were then divided into groups based upon their effective duration and credit rating.  Within each group, bonds were selected by credit spread and low volatility factors; bonds with Libor OAS wider than the median level of the group were ranked by yield volatility, and only the 20% of those ranked bonds with the lowest volatility were then selected.  The weights of selected bonds were designed in such a way that the weight for each grouping matched that of the underlying base universe.

Utilizing a volatility factor is a key step in the index component selection process.  Without the overlay of this factor one is simply picking the cheapest bonds with the widest OAS and, therefore, most likely piling on credit risk.  Screening first by OAS results in a pool of bonds that have higher potential for spread tightening and better carry.  The subsequent low-volatility screening is designed so that bonds with less risk, as demonstrated by their trading pattern, are selected, while duration and credit rating are held equal.  One can think of our selection process as identifying the cheapest bonds with wide credit spreads that are not justified by their historical trading volatility in their respective duration and credit groups.

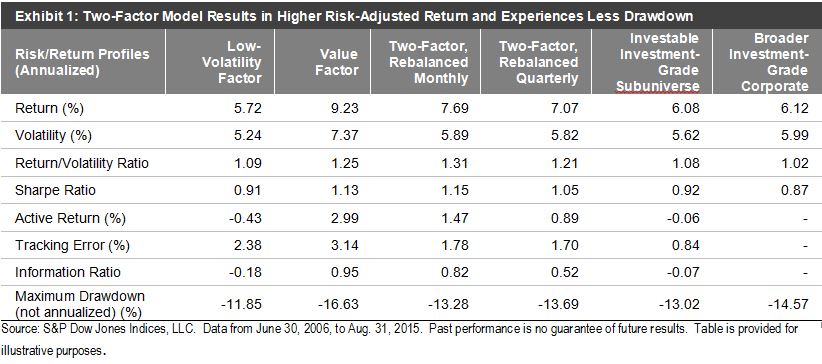
Exhibit 1 shows the improved risk-adjusted return of the two-factor portfolios versus the underlying universe.  The Sharpe ratio for the two-factor model improves to 1.15 (monthly rebalancing) or 1.05 (quarterly rebalanced) from 0.87 of the base universe.  The two-factor model also provides better downside protection, demonstrated by a maximum drawdown of 13.28% (monthly rebalancing) or 13.69% (quarterly rebalanced) compared to 14.57% of the base universe.

Capture

The posts on this blog are opinions, not advice. Please read our Disclaimers.

2015 - The Year of Hope and Despair for the India Market

Contributor Image
Mahavir Kaswa

Former Associate Director, Product Management

S&P BSE Indices

The calendar year (CY) 2015 started with high optimism among domestic and international investors that the recently (September 2014) formed Modi Government would be able to push a reform agenda to help clock GDP growth in India from 8%-10%, if not more. The high expectations could be seen as the S&P BSE SENSEX reached an all-time high of 30,024.74 on March 4, 2015.

Exhibit 1: S&P BSE SENSEX Performance During CY 2015
Sensex Ex 1


Key macroeconomic factors such as falling inflation, falling crude oil prices, current account deficits, and fiscal deficits showed improvement during CY 2015. However, dismal corporate earnings, a poor (or below average) monsoon season, fear of the U.S. Fed increasing interest rates, and concern over the expected slowing of China’s economy were the negative factors for India’s economy throughout the year.

For CY 2015, the S&P BSE SENSEX noted a total return of -3.68% (and price return of -5.0%). The March quarter (Q1) showed the best total return, at 1.85%; in line with global stock markets, the September quarter (Q3) noted the worst total return, at 5.45%, which was primarily on account of growing concern over the slowing of the Chinese economy.

Sensex Ex 2


Let’s See the Contribution of Stocks and Sectors to the S&P BSE SENSEX Total Returns During CY 2015

Stock Contribution

As opposed to other information technology stocks in the index, Infosys Ltd. noted an impressive total return of 14.79%, contributing the most out of all other constituents during the CY 2015 and helping the S&P BSE SENSEX gain 1.15% for the year. Reliance Industries, with its enhanced oil-refining margins and high expectations for the launch of Reliance Jio (an upcoming provider of mobile telephony, broadband services, and digital services), noted positive total returns of over 15%, which pulled S&P BSE SENSEX up by 0.97% at the end of 2015.

The S&P BSE Bankex was down by over 9% during 2015, which can be seen from leading bank constituents that are part of the S&P BSE SENSEX, such as the State Bank of India and ICICI Bank Ltd.; each were down by over 25% and dragged the S&P BSE SENSEX down by 1% and 2%, respectively. However, the HDFC Bank noted total returns of over 14%, helping S&P BSE SENSEX gain by 1.12% for the year.

Sensex Ex 3


BSE Sectors Contribution

Historically, the service sectors such financials and information technology have had significant weights in the broader Indian market and S&P BSE SENSEX.

Out of the 10 BSE sectors, information technology, consumer discretionary, and energy were the only sectors that pulled the S&P BSE SENSEX up in CY 2015. Impressive performance by Infosys Ltd, the falling Indian rupee, low commodity prices, and falling crude oil prices were considered the key reasons for the good performance of these sectors.

Industrials, financials, and materials pushed the S&P BSE SENSEX down the most out of the other BSE sectors. Dismal corporate earnings, low credit growth, rising NPAs, and falling commodity prices were the potential causes of poor performance by these sectors.

Exhibit 4: BSE Sector Contribution to the S&P BSE SENSEX Total Returns During CY 2015 Sensex Ex 4

Outlook

Despite global concerns, India is considered by many to be a bright spot in the coming years (for the medium to long term), assuming internal demand picks up and macroeconomic factors improve; however, there are differences of opinions over the short-term outlook.

The first month of 2016 noted negative total returns of 4.75%, which was the third consecutive month with negative returns. Many hopes have been set on the passage of important legislation such as the GST and Land bills, as well as on the coming budget at the end of February.

The posts on this blog are opinions, not advice. Please read our Disclaimers.

Election Year 2016: Will A Republican President Help Oil?

Contributor Image
Jodie Gunzberg

Former Managing Director, Head of U.S. Equities

S&P Dow Jones Indices

In honor of President’s Day, Election Year 2016 will be a new series of posts about how U.S. presidents and parties have impacted commodities through history. The index history goes back to Jan 2. 1970 when President Richard Nixon was in office. During the time period, there have been eight presidents, including three Democrats and five Republicans.

On average, the annualized returns of commodities during Democratic presidencies was 5.4%, almost 6 times better than under Republican presidencies that added just 0.9%. The S&P GSCI performed best under Republican President Nixon, gaining 21.9% annualized, but it also performed the worst under a Republican President, losing 16.6% annualized under President Ford.

Source: S&P Dow Jones Indices.
Source: S&P Dow Jones Indices. Reds represent Republican Presidents and blues represent Democratic Presidents.

Many have a perception that U.S. Republican Presidents are good for oil given President George W. Bush’s oil business success. Overall, oil performed well during President George W. Bush’s time in office with an annualized return of 4.5%. From his start in 2001 until oil’s peak in July 2008, the commodity returned 388% or 23% annualized.  However, he couldn’t stop the 71% drop that plagued his last six months of office.

It seemed hopeful with a party switch that the next president might help oil recover. Shortly after the inauguration, on Jan. 20, 2009, of the U.S. Democratic President Obama, oil bottomed then gained 179%, that is 56.3% annualized through April 2011. Unfortunately, he wasn’t able to stop an oil drop either, as it has fallen 72%, slightly more than it did in its drawdown under the prior president.

As it turns out, (WTI) crude oil was only added into the index in 1987, so there have been just five presidents to examine, but oil has only been negative under President Obama. Oil performed best under President Clinton with an annualized return of 6.2%, followed by Presidents George W. Bush (4.5%,) Reagan (1.2%,) George H.W. Bush (0.4%) and Obama (-3.4.)

Source: S&P Dow Jones Indices. Reds represent Republican Presidents and blues represent Democratic Presidents.

On average, oil under the Republican Presidents returned 2.1% versus 1.4% under the Democratic Presidents. The Democratic Presidents represented both the best and the worst oil performance with oil performance during Republican Presidencies falling in the middle.

More important than the next elected party, the U.S. government may only have a meaningful impact for oil based on how (if) it regulates oil supply.  Beyond the supply, the strength of the U.S. dollar may be the strongest domestic force on oil prices. There may need to be global coordination between OPEC and non-OPEC suppliers to cut production, and some demand strength from emerging markets, including China, in order for oil to turn around.


The posts on this blog are opinions, not advice. Please read our Disclaimers.

Asian Fixed Income: Southeast Asian Bond Markets

Contributor Image
Michele Leung

Former Director, Fixed Income Indices

S&P Dow Jones Indices

2015 was a difficult year for emerging markets, as investors reduced their exposure to emerging markets and some shifted to developed markets. With concerns about a growth slowdown, a strong U.S. dollar, and the plunge in oil prices continuing to linger, some investors have remained cautious about allocating their exposure to emerging markets.
Looking specifically at the Southeast Asian local debt markets, there is evidence that they have shown resilience when compared with the equity markets; for example, the S&P BSE 500 (TR) climbed 0.45% in 2015, while the S&P BSE India Bond Index rose 8.40% in the same period.
As tracked by the S&P Pan Asia Bond Index, the bond markets in Malaysia, Singapore, Indonesia, India, and Thailand all delivered positive returns last year. In fact, these countries have demonstrated robust growth trends since the index was incepted on Dec. 29, 2006 (see Exhibit 1).

Exhibit 1: Total Return Performance of the Southeast Asian Sovereign Bond Indices20160215

Looking at index performance YTD, the S&P Indonesia Bond Index had a strong start and gained 4.54%, outperforming other Southeast Asian bond indices, which increased by 0.5%-1.5%. As presented in Exhibit 2, the yield-to-maturity of most countries has come down a bit in the past two years, which is in line with the global bond markets.  As of Feb. 10, 2016, the yield-to-maturity of the S&P Malaysia Sovereign Bond Index stood at 3.49%, and its sovereign debt is rated as ‘A-‘ and ‘A3’ by Standard & Poor’s Ratings Services and Moody’s, respectively.

Exhibit 2: Current Yield-to-Maturity of the Southeast Asian Sovereign Bond Indices20160215b

The posts on this blog are opinions, not advice. Please read our Disclaimers.

Seven Commodities To Love

Contributor Image
Jodie Gunzberg

Former Managing Director, Head of U.S. Equities

S&P Dow Jones Indices

It’s no secret commodities have been struggling in 2016 adding pressure to their greatest catastrophe in history. While much of this is from energy, with a year-to-date loss of 24%, the S&P GSCI Non-Energy is only down 1.4% for the year. Further, the precious metals sector in the index is up 17.4% year-to-date. Now that is something to love, and they aren’t the only commodities posting gains this year. Seven commodities are positive year-to-date including gold +17.7%, silver +14.4%, lean hogs +6.6%, zinc +5.9%, lead +2.0%, soybeans +1.1% and corn +0.4%. In honor of Valentine’s Day, below is a poem I wrote to give them the love they deserve.

VDay Comms

I hope you enjoyed something fun and light with this gift from me to you. Happy Valentine’s Day!

The posts on this blog are opinions, not advice. Please read our Disclaimers.