Get Indexology® Blog updates via email.

In This List

Real Estate Rising and GICS

Sukuk Issuance Trend

If You’re Not in the Loans Then You’re Not Getting the Bonds

This Cold Is Hard To Catch

Asia Fixed Income: Diversifying into Chinese Bonds

Real Estate Rising and GICS

Contributor Image
David Blitzer

Former Managing Director and Chairman of the Index Committee

S&P Dow Jones Indices

Real estate, once the villain of the financial crisis, is now lauded as the place to find yield, diversification and maybe stability.  Before REITs became eligible for the S&P 500 in October 2001, real estate investing either meant direct ownership or a specialized corner of the stock market.   The recovery from the financial crisis focused attention on real estate and REITs to understand what happened and why.  With equity markets at record highs and yields and interest rates at record lows, the search for yield is focusing attention on REITs and real estate companies.

Recognizing the growing importance of real estate to investors, S&P Dow Jones Indices and MSCI announced on November 10th that real estate would become a separate sector in GICS­­®, the Global Industry Classification Standard.  Real Estate, previously part of the GICS financial sector, will be the 11th sector while the financials will now be limited to financial services such as banking, insurance or exchanges.  This is the first time since GICS was launched in 1999 that a new sector is being added.  It is not the first change – when GICS was launched a commitment was made to maintain the classifications and update the structure to keep it consistent with the financial markets.

Introducing a new sector for real estate means increased attention to real estate as investors analyze markets and their own asset allocation.  It also means revisions to numerous databases and analytical systems which utilize GICS.  Raising the profile of REITs and real estate management and development companies is likely to encourage the development of new investment products focused on the asset class. Since new analyses and revising databases takes time, the implementation of the new sector will be in August, 2016.  While smaller GICS changes in the past – such as redefining an industry – were usually done with lead times of six to 12 months, comments from clients and investors suggested a longer than usual lead time.

While S&P Dow Jones Indices, together with MSCI, maintains GICS, we do not make decisions about changes in a vacuum.  The key part of the annual GICS structure review is consulting with clients and investors through face to face discussions, emails and web-based survey.  The consultation on Real Estate and REITs revealed that a substantial majority of investors treat real estate as its own asset class. Moreover, this is true in markets globally.  It is no surprise that more and more countries are introducing REIT structures into their tax codes and real estate finance.  Likewise, it is no surprise that REITs and other real estate securities are attractive based on yield.

Adding a new sector to GICS is the largest change in the structure since GICS began; it is also the latest step in industry classifications that go back to the 1920s and Standard Statistics Corporation’s (one of S&P Dow Jones’ predecessors) first index to classify stocks into industries.  That history explains why industry classification must change with the market: among those industries that no longer stand alone are cigar manufacturing, radio and phonograph and leather.

Details on the changes to GICS can be found HERE or HERE

The posts on this blog are opinions, not advice. Please read our Disclaimers.

Sukuk Issuance Trend

Contributor Image
Michele Leung

Former Director, Fixed Income Indices

S&P Dow Jones Indices

According to the Dow Jones Sukuk Index, the new issues that being captured in 2014 YTD totaled USD 11.8 billion, which represents 26% of the index exposure. While the total size of new issues this year is largely in-line with 2013, there are few interesting issuance trends that we observed.

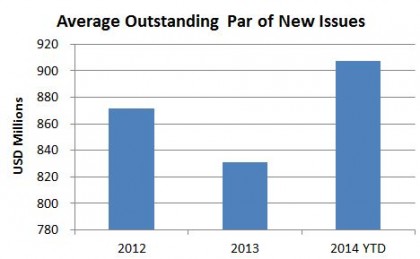
First, the average outstanding par of new issues tracked by the index, is on a rising trend and approaching USD 1 billion, as shown in Exhibit 1. This increase in deal size reflected a stronger investor demand. In fact, some returning issuers such as IDB Trust and Saudi Electric came back to the sukuk market with a larger deal size as well.

Exhibit 1: The Average Outstanding Par of New Issues in the Dow Jones Sukuk Index

Source: S&P Dow Jones Indices. Data as of November 12, 2014.  Charts are provided for illustrative purposes.
Source: S&P Dow Jones Indices. Data as of November 12, 2014. Charts are provided for illustrative purposes.

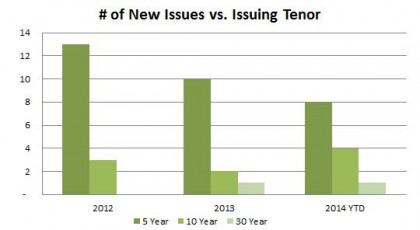
Second, the issuing tenor is extending into longer maturities. While historically sukuk was mostly five-year deals, more ten- and 30-year issuances are now tapping into the market, please see Exhibit 2. And if we look at the current overall index exposure, 32% of the total outstanding par amount was issued with the tenor of ten-year or above.

Exhibit 2: The Number of New Issues vs. Issuing Tenor in the Dow Jones Sukuk Index

Source: S&P Dow Jones Indices. Data as of November 12, 2014.  Charts are provided for illustrative purposes.
Source: S&P Dow Jones Indices. Data as of November 12, 2014. Charts are provided for illustrative purposes.

Last but not least, we continue to see emergence of new issuers in the sukuk market. For example, HK Government and South Africa Sovereign both recently issued a five-year deal, while Goldman Sachs also raised a $500mio for a five-year sukuk in the same period.

Want to find out more information about the Dow Jones Sukuk Index? Please click here.


The posts on this blog are opinions, not advice. Please read our Disclaimers.

If You’re Not in the Loans Then You’re Not Getting the Bonds

Contributor Image
Kevin Horan

Former Director, Fixed Income Indices

S&P Dow Jones Indices

There is an axiom among the capital markets desks of investment banks that goes something like this: “if you’re not in the loans then you’re not getting the bonds”.

The reasoning behind this statement is this: Other than fallen angels, the issuers of high yield debt are companies whose access to capital can be limited.  Start-up companies, whose story resonates with bankers, need to build relationships with lenders or existing companies whose line of business is highly leveraged.

For this reasoning, there is a significant amount of overlap between the issuers of leveraged loans and high yield paper. In a recent article, Invesco Fund Treads Risky Path as Major Investor in Distressed Corporate Debt, it is mentioned that Invesco PowerShares’s BKLN has major exposures to companies with weak balance sheets. However, an aspect of leveraged loans that was not developed in this article is that the loans are secured by the assets of the operating company and the terms are usually superior to those of high-yield bonds, which are generally unsecured.

Also a benefit to the senior loan structures is that loans are floating-rate instruments, which have coupon resets periodically with the prevailing benchmark for the interest rate (i.e., LIBOR).  Why is this important?  All things being equal, a rising interest rate environment will generally result in higher interest payments for those holding senior bank loans while not significantly impacting loan prices.   If or when a credit event does occur with a loan, the recovery rates on bank loans are 86%, much higher than the recovery rates secured, unsecured or subordinated bonds.

The issuers in the S&P/LSTA U.S. Leveraged Loan 100 Index are the same issuers in the S&P U.S. High Yield Corporate Bond Index. Currently the S&P/LSTA U.S. Leveraged Loan 100 Index has returned 0.12% MTD and 2.20% YTD while the S&P U.S. High Yield Corporate Bond Index has returned -0.20% MTD and 4.78% YTD.

Source: S&P Dow Jones Indices, data as of 11/07/2014

The posts on this blog are opinions, not advice. Please read our Disclaimers.

This Cold Is Hard To Catch

Contributor Image
Jodie Gunzberg

Former Managing Director, Head of U.S. Equities

S&P Dow Jones Indices

Many people are asking if we are seeing withdrawals from commodities since oil has dropped about 25% since its high in June.  While we don’t track asset flows of products based off the indices, the anecdotal answer is many view this as a buying opportunity.  The IEA predicts an acceleration of oil demand growth from non-OECD countries of 2.6% in 2015 up from 1.9% in 2014 that can be mainly attributed to Asia, Africa, and the Middle East. While lower oil prices could change this, it is more likely to cause a great divide between where the demand comes from, with proportionally more from Asia.

The next question being asked is whether the potential buying opportunity is better executed with active or passive strategies.  That depends on how much confidence you have that you can pick the winner.  Did you guess that Algeria would only secure 4 out of 31 available licenses to international companies to explore and produce? or that a local strike in Libya would take 25 kb/d off the market in an instant? or that Beijing would buy 8 million barrels of Middle East crude as Brent fell under $90/bbl? Only the foresight around situations like these- or luck- would result in proftable in alpha strategies.

In this mean reverting environment with inventories hovering closer to equilibrium than they have post the financial crisis, picking the winner is difficult.  I didn’t hear too many predictions that coffee, aluminum, cattle and nickel would be among the winners this year.

That said, last week, did you guess natural gas would be up 13.7% this week?  The headline in the WSJ is around cattle from the drought that has been driving cattle prices up about 30% this year- but it’s nothing to moo about in November. However, the return of the Polar Vortex is something to chatter about. Maybe equities are more dependent on sunshine, but not natural gas.

Earlier in the year, from Jan 9-29, the DJCI Natural Gas, increased 37.4%, and in just the first three days of that time period, 8.6% or almost 1/4 of the return was already earned. This time, natural gas bottomed on Oct. 27 and is up already 20.9% as of Nov. 6th. Again, in the first three days, 1/4 of the return was earned.

So, if you want to play the guessing game, you better pick right and ON TIME, or else you are missing out.  Many prefer to stay invested broadly to avoid the picking and timing trap- as this cold was hard to catch.


The posts on this blog are opinions, not advice. Please read our Disclaimers.
Asia Fixed Income: Diversifying into Chinese Bonds

Contributor Image
Michele Leung

Former Director, Fixed Income Indices

S&P Dow Jones Indices

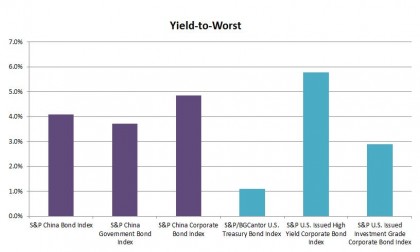
Global investors continue to explore investment opportunities in China onshore bond market. Chinese bonds undeniably offer higher yields than other major bond markets. As of Nov 5, 2014, the yield-to-worst of the S&P China Bond Index stood at 4.09% with a modified duration of 4.15, see Exhibit 1.

Exhibit 1: Yield Comparison

Source: S&P Dow Jones Indices. The S&P China Bond Index, the S&P China Government Bond Index and the S&P China Corporate Bond Index are calculated in CNY. The S&P/BGCantor U.S. Treasury Bond Index, the S&P U.S. Issued High Yield Corporate Bond Index and the S&P U.S. Issued Investment Grade Corporate Bond Index are calculated in USD. Data as of November 5, 2014. Charts are provided for illustrative purposes.

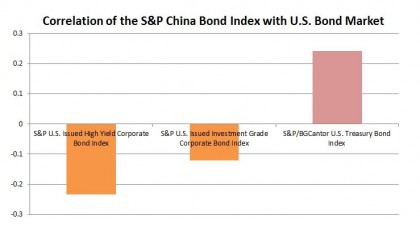
More importantly, investing into Chinese bonds adds diversification benefits to a portfolio through the exposure to local rate, credit and currency. According to the S&P China Bond Index, the Chinese bonds have historically exhibited low to negative correlations to U.S. bonds.

The correlation between the S&P China Government Bond Index and the S&P/BGCantor U.S. Treasury Bond Index, considering monthly returns since Dec, 2006, is 0.25. And if we look at the corporate bond sector, the correlation between the S&P China Corporate Bond Index and the S&P U.S Issued Investment Grade Corporate Bond Index is -0.15, while its correlation with the S&P U.S Issued High Yield Corporate Bond Index is -0.22, see Exhibit 2.

Exhibit 2: Bond Market Correlation

Source: S&P Dow Jones Indices. The S&P China Corporate Bond Index is used to run the correlation with the S&P U.S. Issued High Yield Corporate Bond Index and the S&P U.S. Issued Investment Grade Corporate Bond Index, in orange color. The S&P China Government Bond Index is used to run the correlation with the S&P/BGCantor U.S. Treasury Bond Index, in red color. Correlations are based on the monthly returns since December 29, 2006. Data as of November 4, 2014. Charts are provided for illustrative purposes.

The Chinese bond market has outperformed the U.S. treasury and corporate bond markets year-to-date as well. As of Nov 5, 2014, the S&P China Bond Index delivered a YTD total return of 10.08%.

Want to find out more about the S&P China Bond Index? Please click here.

The posts on this blog are opinions, not advice. Please read our Disclaimers.