Get Indexology® Blog updates via email.

In This List

Et tu, Robo?

Impact of the Affordable Care Act (ACA) on Total Business vs Total Business less Individual Market Trends

Impact of the Affordable Care Act (ACA) on Enrollment

How Two Robo-Advisors Define Core

How did South African active managers perform against their benchmarks in 2014?

Et tu, Robo?

Contributor Image
Shaun Wurzbach

Managing Director, Head of Commercial Group (North America)

S&P Dow Jones Indices

Many US financial advisors must feel like they are “under the gun” as the President and parts of his administration call for a stronger fiduciary standard.  Simultaneously, I receive several emails per day on “robo-advisors” and how they spell doom for financial advice as we know it.  I find the second challenge to financial advisors much more interesting.   I’ll share my reasons for why I think that robo-advice may disrupt the business of some financial advisors.

Robo-advice is a form of financial advice that provides portfolio management online with no or minimal human intervention.  Robo recommendations are generally index-based products in an all-asset and global portfolio which is selected by algorithms based on client input and risk tolerances.  The consensus seems to be that robo-advisors aren’t serving high net worth clients.  This is where many articles I have read end and suggest that after all, advisors need not worry since robos don’t compete for the same clients.  So, no conflict, right?  The mass affluent client or professional millennial who is emerging affluent that a robo-advisor recruits today is below a financial advisor’s investable asset minimum.  But any wealth management firm with a strategic plan needs to realize that robo-advice is actively targeting its client of the future.  And if robos provide useful and inexpensive financial advice to that client for any meaningful period of time, then what incentive will that client have to switch over to “full service” wealth management at some future date?

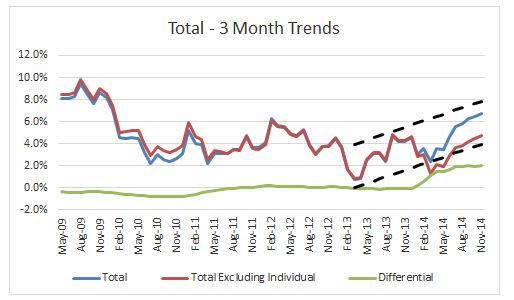
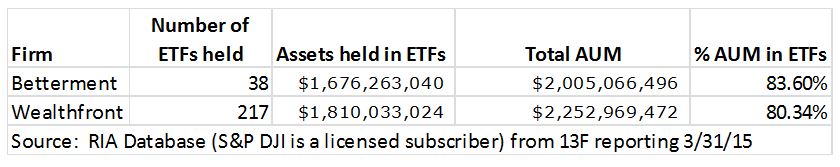
How disruptive might this be to financial advisors as a whole?  That depends on how many of their future clients robos can pick off.  We have some insight now on how well robos are doing in targeting these future clients, and let’s just say that some of them are gathering assets like…a machine.  Two of the better-known robo-advisors are New York-based Betterment and California-based Wealthfront.  Since both these firms are registered with the SEC as RIAs, we can see details about their compounded annual growth rates:

Capture

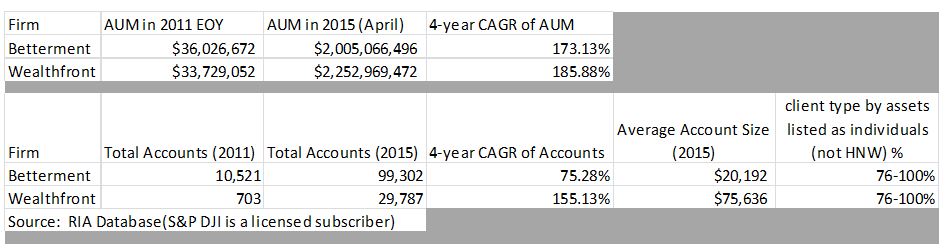
Seen from the perspective of an RIA, these two robo-advisors are large in AUM, growing extremely fast, and they have accumulated their growth by targeting relatively small account clients.  Some articles make the point that these two robo-advisor firms are not yet profitable and sustain themselves on private equity money.  With the CAGRs they have proven in AUM and client acquisition, how much longer will this lack of profitability be factual?   And how disruptive will this be if in three years, if each of these firms is at $10 Billion dollars in AUM?  Not possible?  Vanguard Personal Advisor Services, which I consider to be a hybrid of robo and human advice is now at $17 Billion in AUM.

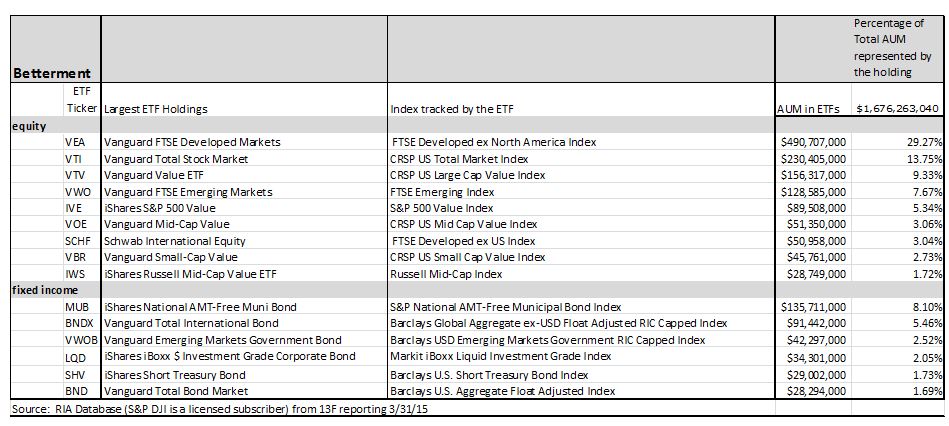
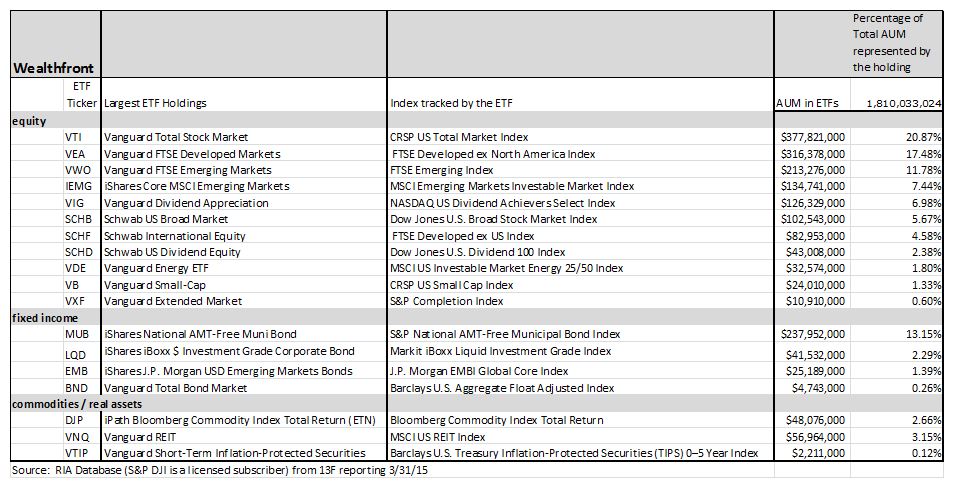
Another aspect of this disruption is that like RIA strategists, robo-advisors are power-users of indexing and ETFs.  In my next post I will look at what Betterment and Wealthfront reportedly hold and how I think that what they hold may inform core investing and asset allocation.

In the end, I believe that some human financial advisors will mitigate this disruption risk by either adopting a robo-advice capability themselves or by sharpening and effectively communicating how their value and service differs from robo-advice.  Those advisory firms which fail to adapt to what robo-advice means as a disruptor may find it much harder to compete or to be profitable in the years to come.

The posts on this blog are opinions, not advice. Please read our Disclaimers.

Impact of the Affordable Care Act (ACA) on Total Business vs Total Business less Individual Market Trends

Contributor Image
John Cookson

Principal, Consulting Actuary

Milliman

The chart below shows the history of the S&P Claims Based Indices trends for total business and also total business less individual.  Up until 2014 the total and the total less individual were generally within a half a percent or so on a three month moving average trend basis. However, with the advent of the ACA in 2014, as individual trends shot up significantly, the gap between total and total less individual increased to about 2% at this point. This does not appear to be just an increase in individual trends, it is accompanied by a significant simultaneous reduction in non-individual trends. Starting in 2014 we have been forecasting trends to begin upward movement as a result of the improved economic recovery, but we have not yet seen any evidence of this on the LG/ASO trends. However, if we look at the total trends in the Chart below we can see that the trends appear to have bottomed out near the beginning of 2013 and have had a consistent upward movement through the available time periods as of November 2014.

Capture

We expect that trends will continue their upward movement in total, but the impact on LG/ASO will vary depending upon the results of what happens to individual trends and small group trends in 2015.  If individual trends return to more normal levels in 2015 this will likely lead to an upward movement in LG/ASO trends relative to 2014.

THE REPORT IS PROVIDED “AS-IS” AND, TO THE MAXIMUM EXTENT PERMITTED BY APPLICABLE LAW, MILLIMAN DISCLAIMS ALL GUARANTEES AND WARRANTIES, WHETHER EXPRESS, IMPLIED OR STATUTORY, REGARDING THE REPORT, INCLUDING ANY WARRANTY OF FITNESS FOR A PARTICULAR PURPOSE, TITLE, MERCHANTABILITY, AND NON-INFRINGEMENT.

The posts on this blog are opinions, not advice. Please read our Disclaimers.

Impact of the Affordable Care Act (ACA) on Enrollment

Contributor Image
John Cookson

Principal, Consulting Actuary

Milliman

Given the sharp uptick in individual trends in 2014, which have peaked at 45% on a three-month moving basis, our operative scenario is that some of these new enrollees are crowding out care on the LG/ASO lines of business. The reason is that these new enrollees, many of whom have not had insurance and others who have had very limited insurance in the past, have accumulated a backlog of urgent medical needs. Whereas those with traditional insurance are most likely dealing with elective care except for newly emerging urgent needs. Thus, the backlog of urgent needs of the newly insured both in individual/commercial and Medicaid insurance is deferring more of the elective care in the LG/ASO lines of business. This is lowering the LG/ASO trends from what they might otherwise be while simultaneously substantially increasing the individual trends as shown in the S&P Healthcare Claims Indices.

These effects are further confounded by other effects of the ACA.  For example, large groups, and even small groups, are shifting to ASO products to avoid some of the ACA taxes and fees.  Furthermore, some small employers, and even larger ones, may have cut coverages and forced their employees into the individual exchanges.

For 2015, we would expect a drop in the trends shown in individual since some of the unmet needs will have been taken care of in 2014. We could even see negative trends depending on the level of new enrollments and their level of needs. However, SG enrollment has increased under the ACA as the electronic enrollment and exchanges for SG have opened in 2015.  We don’t expect such a significant impact on SG trends in 2015 as occurred on individual in 2014. However, if they do have a significant increase in trend, albeit less than individual excess trend rates, this could continue to have a depressing effect on LG/ASO trend levels.

THE REPORT IS PROVIDED “AS-IS” AND, TO THE MAXIMUM EXTENT PERMITTED BY APPLICABLE LAW, MILLIMAN DISCLAIMS ALL GUARANTEES AND WARRANTIES, WHETHER EXPRESS, IMPLIED OR STATUTORY, REGARDING THE REPORT, INCLUDING ANY WARRANTY OF FITNESS FOR A PARTICULAR PURPOSE, TITLE, MERCHANTABILITY, AND NON-INFRINGEMENT.

The posts on this blog are opinions, not advice. Please read our Disclaimers.

How Two Robo-Advisors Define Core

Contributor Image
Shaun Wurzbach

Managing Director, Head of Commercial Group (North America)

S&P Dow Jones Indices

I was intrigued by the recent Barron’s cover story on robo-advice.  The Barron’s article described example portfolios for Betterment, Charles Schwab, Vanguard Personal Advisor Services, and Wealthfront.  As I mentioned in my last post, robo-advisors are power-users of indexing and ETFs.  So I thought that it would be interesting to compare and contrast some of the ETF holdings of two of these robo-advisors, with my assumption being that the portfolios that these robos would construct will be bare-bones, no frills core portfolios. Emerging and mass affluent clients currently are underserved with regard to strategic asset allocations.

The Barron’s article had me expecting to find that the RIAs Betterment and Wealthfront held 10-12 ETFs for their clients.  Not the case.  I was surprised by the breadth of their ETF holdings and by the percentage of assets which they have committed to index-trackers.

Capture

Cerulli data from EOY 2014 indicates that RIAs, on average, have approximately 80% of client assets in ETFs.  So these two robo-advisors are at roughly 400% of the average.

Next, I wanted to see how these two robo-advisors are using indexing and ETFs to create core portfolios.  To be clear, I can only see the aggregate of their holdings, not individual client accounts.  Based on their average client size ($20,192 for Betterment and $75,636 for Wealthfront) and the amount of AUM in certain ETFs, I can draw some conclusions about the ETFs which are most commonly recommended by these two robo-advisors:

Capture

Capture

First, the ETF holdings of both robo-advisors do show a focus on core building blocks such as total market solutions and capturing entire asset classes in a single ETF.  Such an approach is a simple and inexpensive way to deliver market exposure.  Both robo-advisors show a willingness to use an emerging markets debt ETF for exposure to that asset class.  And interestingly, both choose the same ETF for exposure to municipal bonds.  The large AUM which each robo-advisors hold in a muni bond ETF reflect widespread use of indexing as the method to deliver diversified and national exposure to munis.  Key differences are seen in some of the ETFs used, which may reflect different trading costs due to custodial relationships.  Wealthfront also shows Commodity, TIP, and REIT holdings at a higher level than Betterment.  Wealthfront, in the large number of different ETFs that they hold for clients, also demonstrates difference in breadth of choice or perhaps in their willingness to customize portfolios for clients.

How these two robo-advisors have defined core portfolios and strategic asset allocation with ETFs is not only interesting now, but may serve as an interesting source of data and insights for the future.  Structurally and philosophically, I assume from what I have read that the robo-advisors will not encourage frequent trading and will educate investors to stick with their algorithmically-determined investment strategy.  Will the robo-advisors eventually publish “cohort” results over time and over business cycles?  If so, it will be interesting to see how effective these strategic asset allocation portfolios are in wealth accumulation and preventing the type of actual investor results which have been documented in years of DALBAR Quantitative Analysis of Investor Behavior studies.

The posts on this blog are opinions, not advice. Please read our Disclaimers.

How did South African active managers perform against their benchmarks in 2014?

Contributor Image
Daniel Ung

Former Director

Global Research & Design

Following the success of the SPIVA (S&P Indices versus Active) in the U.S., Australia, Canada, India, Japan, Europe and Latin America, we are now starting coverage on South Africa. Like the reports covering other regions, we aim to shed some light on the ongoing active vs. passive debate.  SPIVA South Africa will be published twice a year, mid-year and at the end of the year.

Let’s take a look at the results of the past year.

Overall, 2014 was somewhat mixed for South Africa, owing to labor disputes, electricity shortages and weak domestic demand. However, the performance of ZAR-denominated domestic equities, as measured by the S&P South Africa Domestic Shareholder Weighted (DSW) Index, held up reasonably well and went up by 16% over the year. However, they still lagged global equities as a whole.

Given the volatility over the year, we would have expected active managers to outperform their benchmarks but this did not turn out to be the case. Indeed, South African active equity managers underperformed their benchmarks in all equity fund categories and over all time horizons. (see Report 1 below).

In regards to fixed income, the results were less consistent. While active managers beat their respective benchmark in the short-term bond category, this was not the case in the longer-term diversified/aggregate category.

Capture

The posts on this blog are opinions, not advice. Please read our Disclaimers.