






Broad digital asset benchmarks are generally dominated by a single asset. For example, Bitcoin’s weight in the S&P Cryptocurrency Broad Digital Asset (BDA) Index averaged 59% over the past five years. The S&P Pantera Digital Asset Index takes a different approach. Its composition is driven primarily by strict screening for financial viability, and it holds a concentrated basket of smart-contract platforms and exchange tokens with no Bitcoin exposure.
Over its full history, which is back-tested prior to the index’s July 20, 2026, launch, this design has translated into strong results. Since the start of the back-tested period on June 30, 2021, the S&P Pantera Digital Asset Index has gained 149.4%, or 19.0% annualized, compared with an annualized gain of 7.8% for the S&P Cryptocurrency BDA Index and an annualized loss of 5.8% for the S&P Cryptocurrency BDA Ex-Bitcoin Index. It did so with comparable annualized volatility (67% versus 61% and 69%, respectively) and a shallower maximum drawdown (-72.0% versus -76.0% and -79.0%, respectively). The result is a risk-adjusted performance of 0.28, more than double the S&P Cryptocurrency BDA Index’s 0.13 and well above the S&P Cryptocurrency BDA Ex-Bitcoin Index’s fall of 0.08.
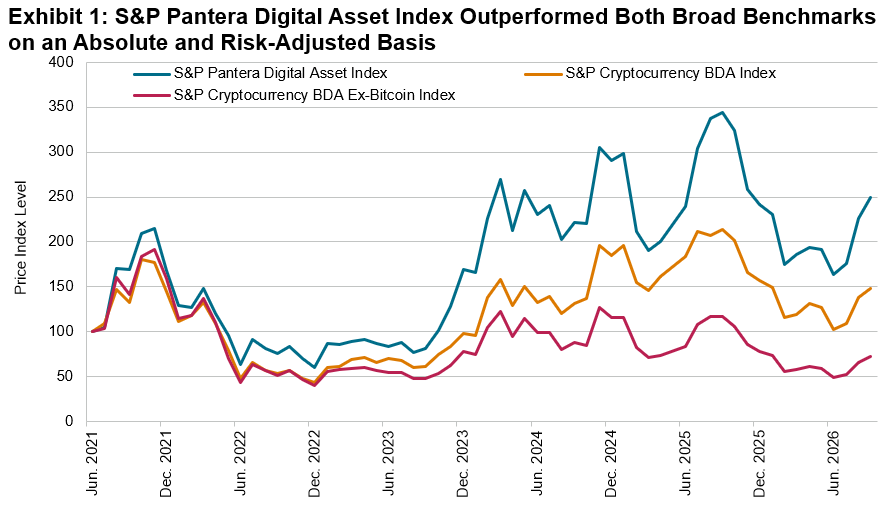
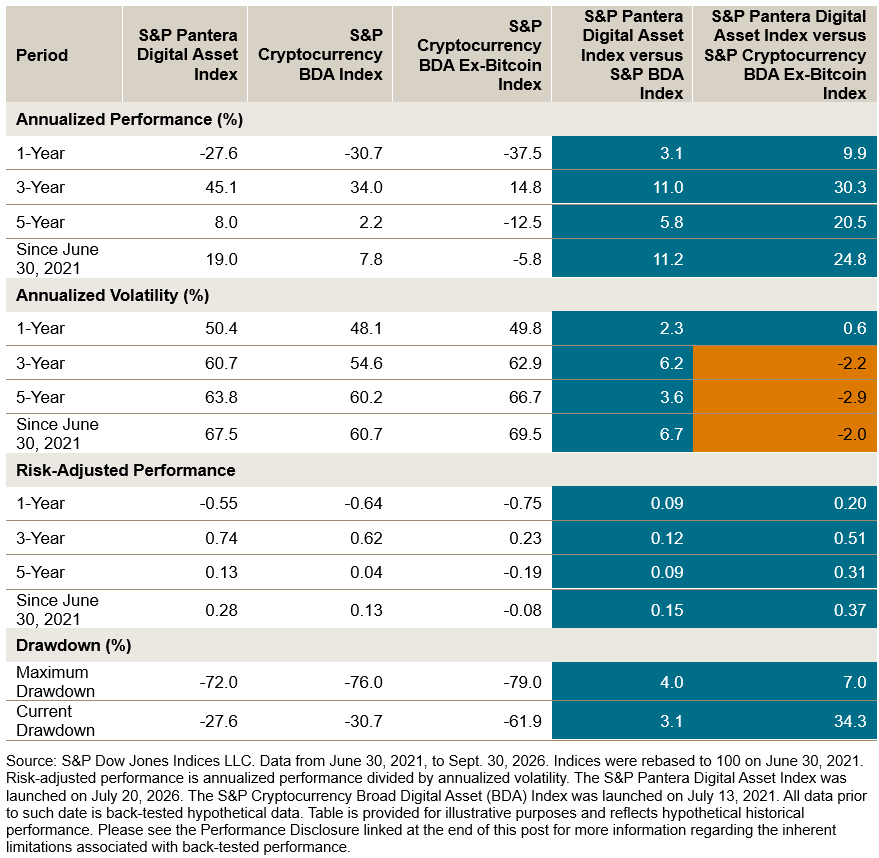
Calendar-year results indicate that the outperformance seen in Exhibit 1 has not been uniform. The S&P Pantera Digital Asset Index outperformed the S&P Cryptocurrency BDA Index in four out of six years, led by 2023 (outperforming by 56.9 percentage points), and lagged most in 2024 (underperforming by 18.2 percentage points), when Bitcoin led the market. It outperformed the S&P Cryptocurrency BDA Ex-Bitcoin Index in all six years, indicating that its outperformance was not only due to the exclusion of Bitcoin.
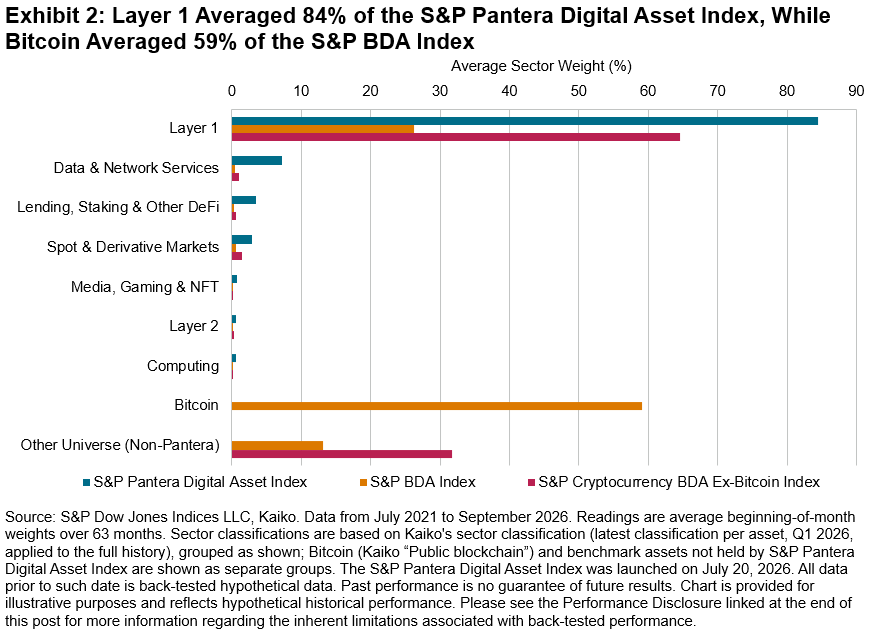
The index’s composition helps explain the pattern seen in Exhibit 2. Layer 1 networks¹ averaged 84.5% of the S&P Pantera Digital Asset Index, 58.2 percentage points above the S&P Cryptocurrency BDA Index, while Data & Network Services averaged 7.2%. The index is also concentrated, with its top three holdings averaging 74.3% of its total weight.
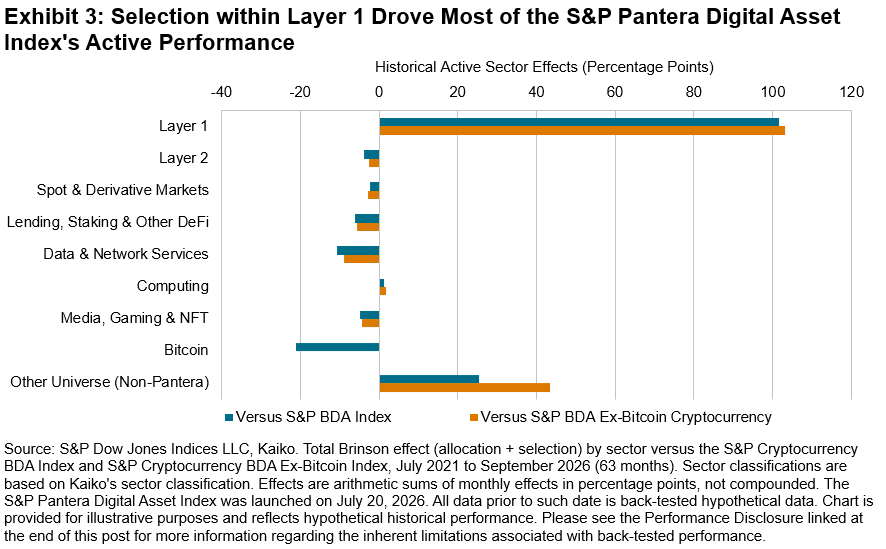
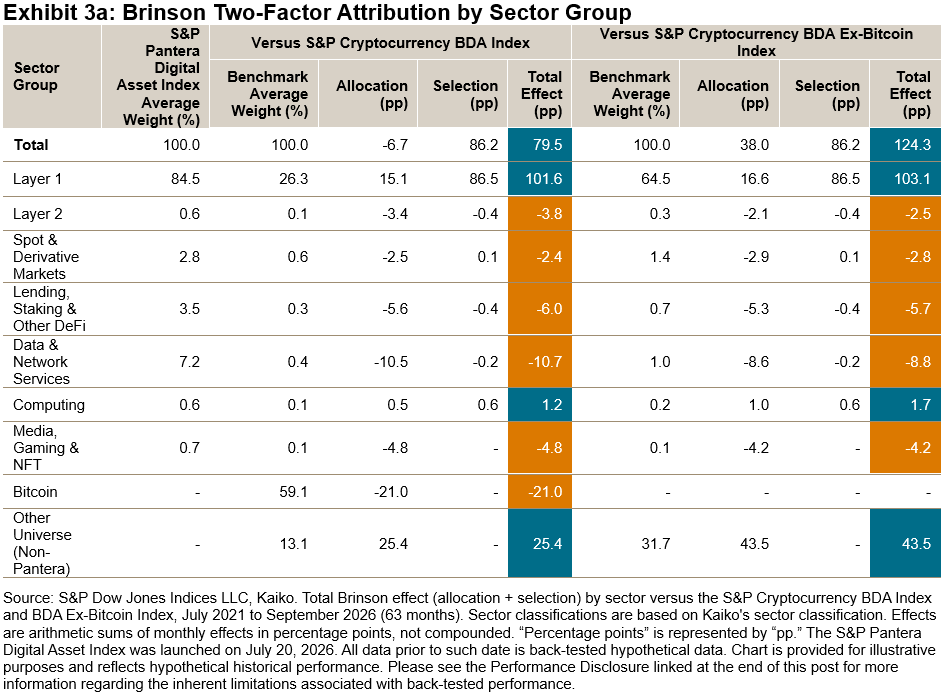
Attribution analysis indicates that sector allocation accounts for only part of the S&P Pantera Digital Asset Index’s performance. Monthly Brinson 2-Factor attribution against the S&P Cryptocurrency BDA Index yields 79.5 percentage points of cumulative active effect: -6.7 from allocation and 86.2 from selection. Selection within Layer 1 (86.5) drove most of it, meaning the S&P Pantera Digital Asset Index benefited from owning specific Layer 1 networks rather than the sector broadly. Within allocation, excluding Bitcoin cost the index 21.0 percentage points, while avoiding the long tail of smaller, speculative assets added 25.4 and the Layer 1 overweight added 15.1; overweights in the smaller non-Layer 1 sectors cost 26.3 (led by Data & Network Services, -10.5).
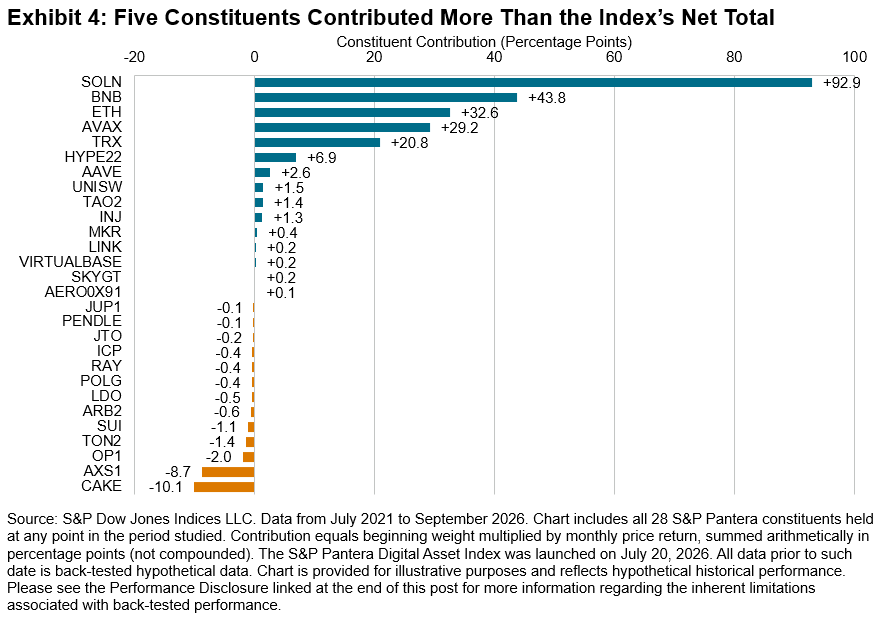
Constituent-level contributions are consistent with the findings in Exhibit 4: gains were concentrated in a handful of Layer 1 networks, while losses were contained. Solana (up 92.9 percentage points), BNB (up 43.8), Ether (up 32.6), Avalanche (up 29.2) and TRON (up 20.8) together contributed 219.3 percentage points, more than the 208.2 percentage points contributed by all 28 constituents combined. The 13 detractors cost 25.9 percentage points in total, and 11 of them cost less than 2 points each. Severe losses were also rarer: 7% of S&P Pantera Digital Asset Index constituents fell 90% or more while held, versus 19% for the S&P Cryptocurrency BDA Index, suggesting that the index’s financial viability screening may help avoid tokens that are more likely to experience dramatic declines in value.
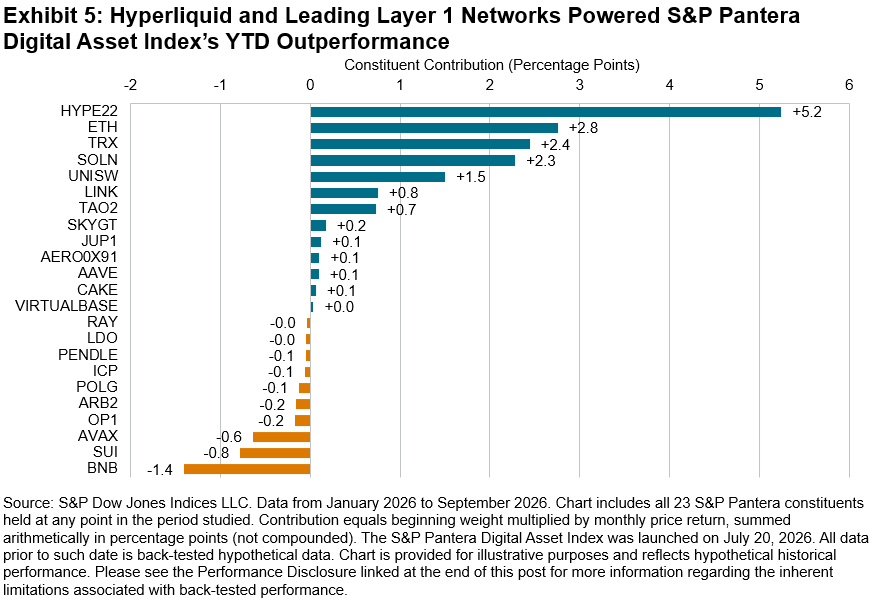
Year-to-date results tell a similar story. Through September, the S&P Pantera Digital Asset Index gained 3.0%, versus a loss of 5.4% for the S&P Cryptocurrency BDA Index and a loss of 7.1% for the S&P Cryptocurrency BDA Ex-Bitcoin Index. Not holding Bitcoin cost only 0.6 percentage points; the lead came from what the index did include. Four constituents contributed 12.7 of the 12.8 percentage points total, led by Hyperliquid (up 5.2), a DeFi asset rather than a Layer 1.
Conclusion
Overall, the S&P Pantera Digital Asset Index’s back-tested results seem to trace back to its financial viability screen. By focusing on assets that generate economic activity, the screen tended to tilt the index toward smart-contract platforms and exchange tokens, so its infrastructure overweight reflects where that activity sits within the asset class rather than a standalone sector bet. Including the strongest of those networks while avoiding the speculative long tail drove most of the outperformance, while excluding Bitcoin remained the main trade-off, as 2024 showed.
1 Kaiko’s sector classification assigns each digital asset to a sector based on its primary use case and is published quarterly; this analysis uses Kaiko’s quarterly history (Q1 2020-Q1 2026) and applies each asset’s latest classification to the full history. Kaiko sectors are grouped for presentation (e.g., Staking, Decentralized Lending, Investment and Prediction Market as “Lending, Staking & Other DeFi”; Network, Data Service, Certification & Identity, Cross-chain Interoperability, Governance tools and Business Services as “Data & Network Services”; Media Service, NFT, Gaming and Social network & Messaging as “Media, Gaming & NFT”). Toncoin is mapped manually to Kaiko’s “ton” code.
The posts on this blog are opinions, not advice. Please read our Disclaimers.