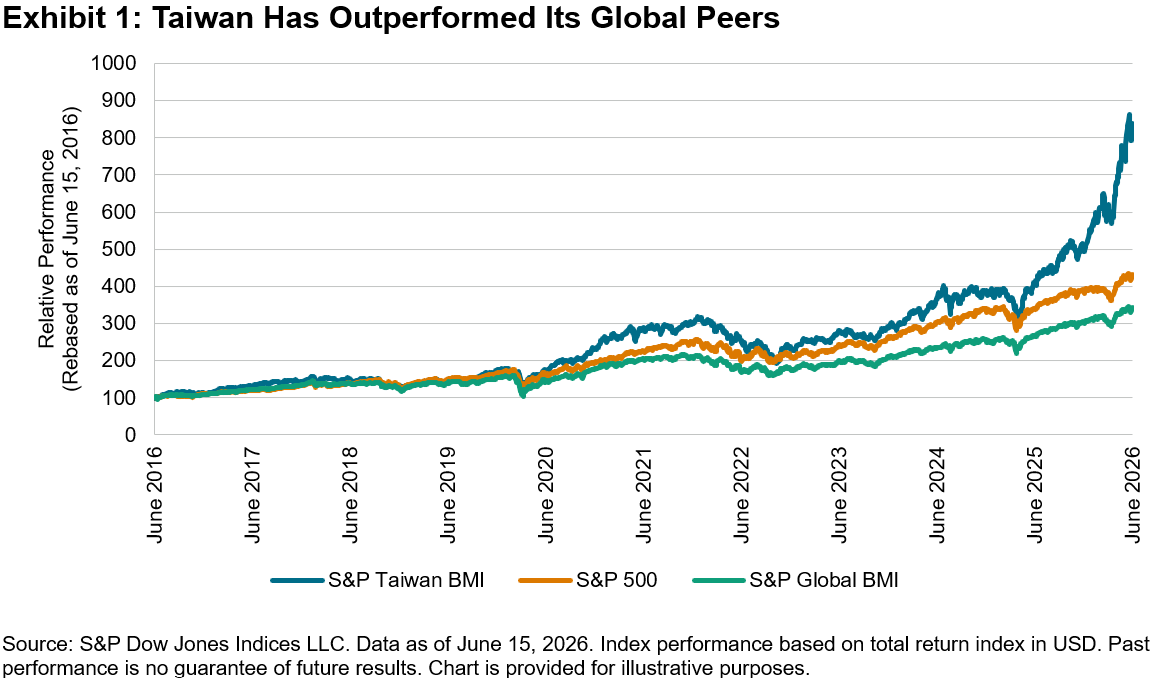
Few economies are as deeply embedded in the global technology supply chain as Taiwan. Its highly sophisticated chip manufacturing network benefits from demand across a broad range of high-value end markets, from AI infrastructure and data centers to smartphones and electric vehicles. This positioning has propelled the S&P Taiwan BMI to an average annualized gain of 23.4% in Taiwanese dollar terms (23.7% in U.S. dollar terms) over the past 10 years, significantly outperforming global equities, as measured by the S&P Global BMI, and U.S. equities, as measured by the S&P 500®.
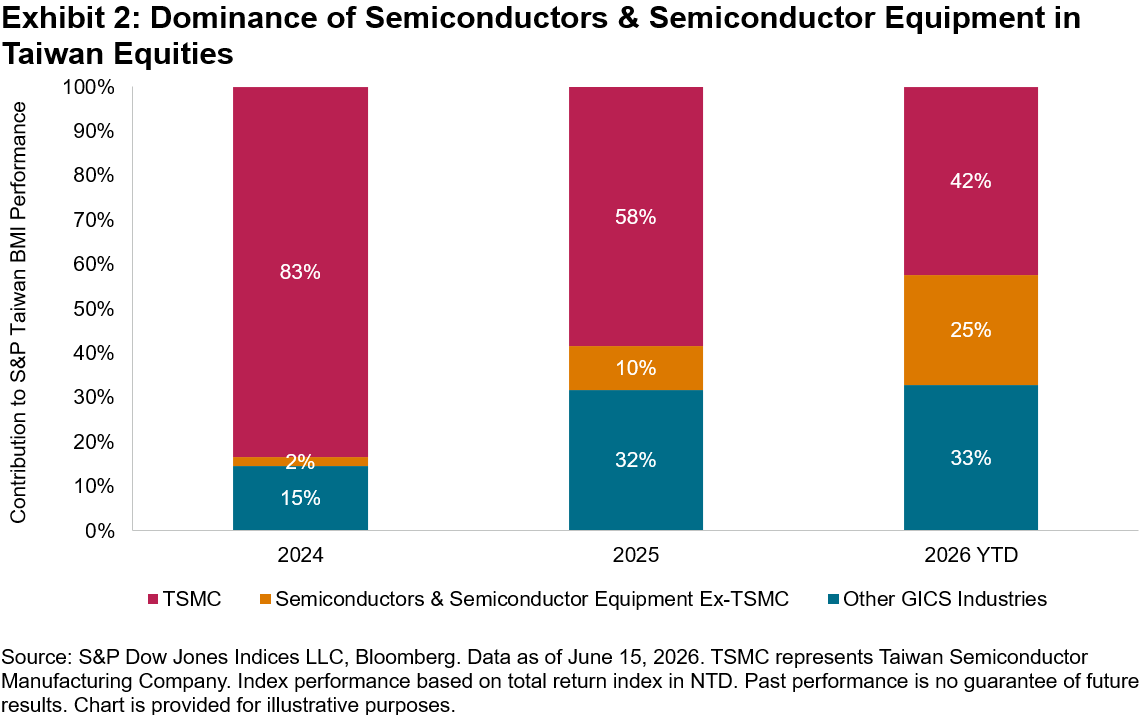
When markets are rising, strong performance can grab the headlines and risks can often be overlooked. One of the primary risks in Taiwanese equities is concentration. The market’s reliance on the semiconductor industry is evidenced by the fact that the Taiwan Semiconductor Manufacturing Company (TSMC) alone represented a 44% weight in S&P Taiwan BMI, as of June 15, 2026. As illustrated in Exhibit 2, at the GICS® industry level, Semiconductors & Semiconductor Equipment accounted for roughly two-thirds of the S&P Taiwan BMI’s gains in 2025 and 2026 YTD.
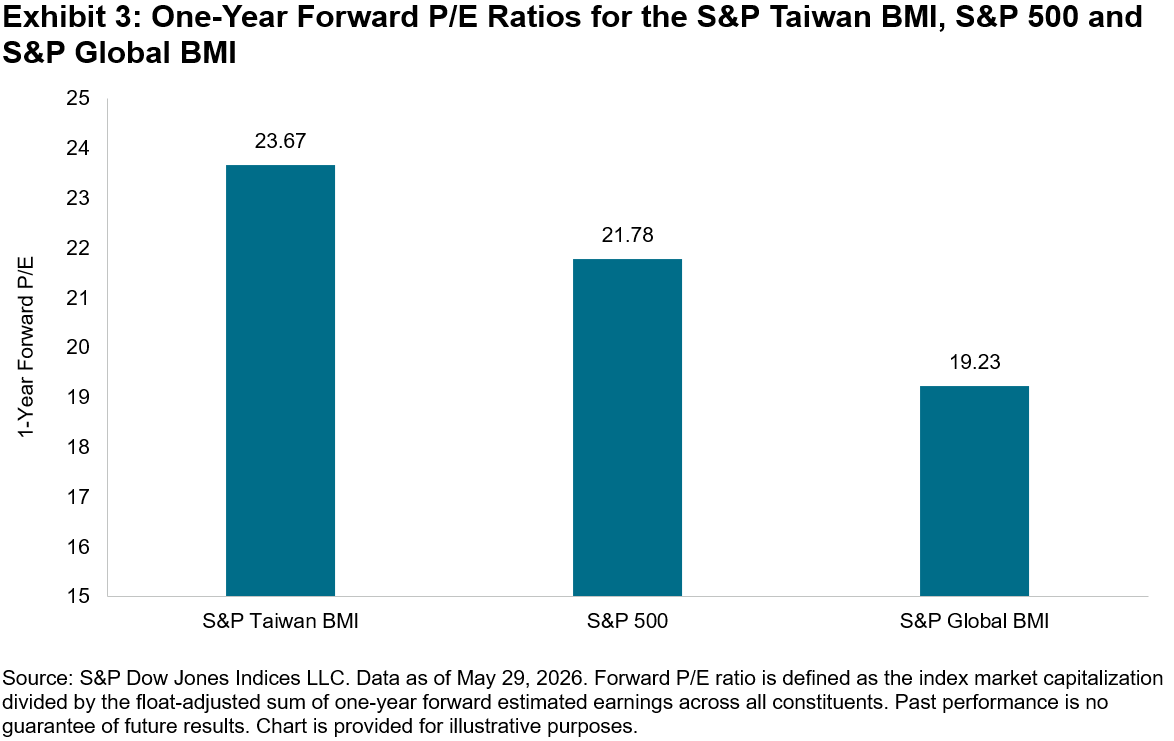
Valuation has also risen to a more stretched level. As of May 29, 2026, the one-year forward price/earnings (P/E) ratio of the S&P Taiwan BMI had risen to 23.67, at premiums of 9% and 23% to the S&P 500 and S&P Global BMI, respectively. While valuations are not indicators of market direction, high valuations may provide context for assessing sensitivity to changes in market sentiment.
Given the concentration risk and elevated valuation of Taiwanese equities, global diversification may be a relevant consideration when evaluating Taiwan-based strategies. For a Taiwan-based equity strategy, a globally diversified index offers three things:
- Diversified sector profile that balances technology and other sectors;
- Diversified regional profile; and
- Reduced
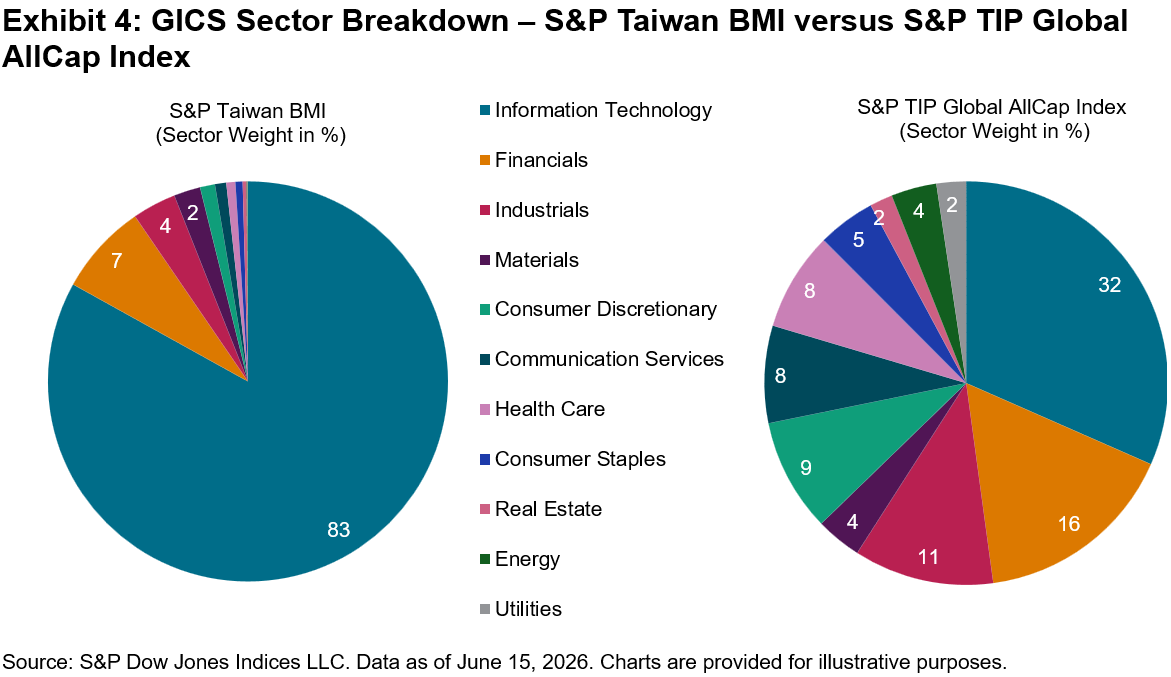
The S&P TIP Global AllCap Index targets 90% of the float-adjusted market capitalization of the S&P Global BMI and represents a broader global equity universe than a Taiwan-focused strategy.1 The index included 2,272 constituents across 48 markets as of June 15, 2026. Exhibit 4 highlights a more balanced sector profile of the S&P TIP Global AllCap Index compared with the S&P Taiwan BMI’s 83% weight in Information Technology. Lastly, the S&P TIP Global AllCap Index has traded at a more moderate valuation, with a one-year forward P/E ratio of 18.96, compared with 23.67 for the S&P Taiwan BMI as of May 29, 2026.
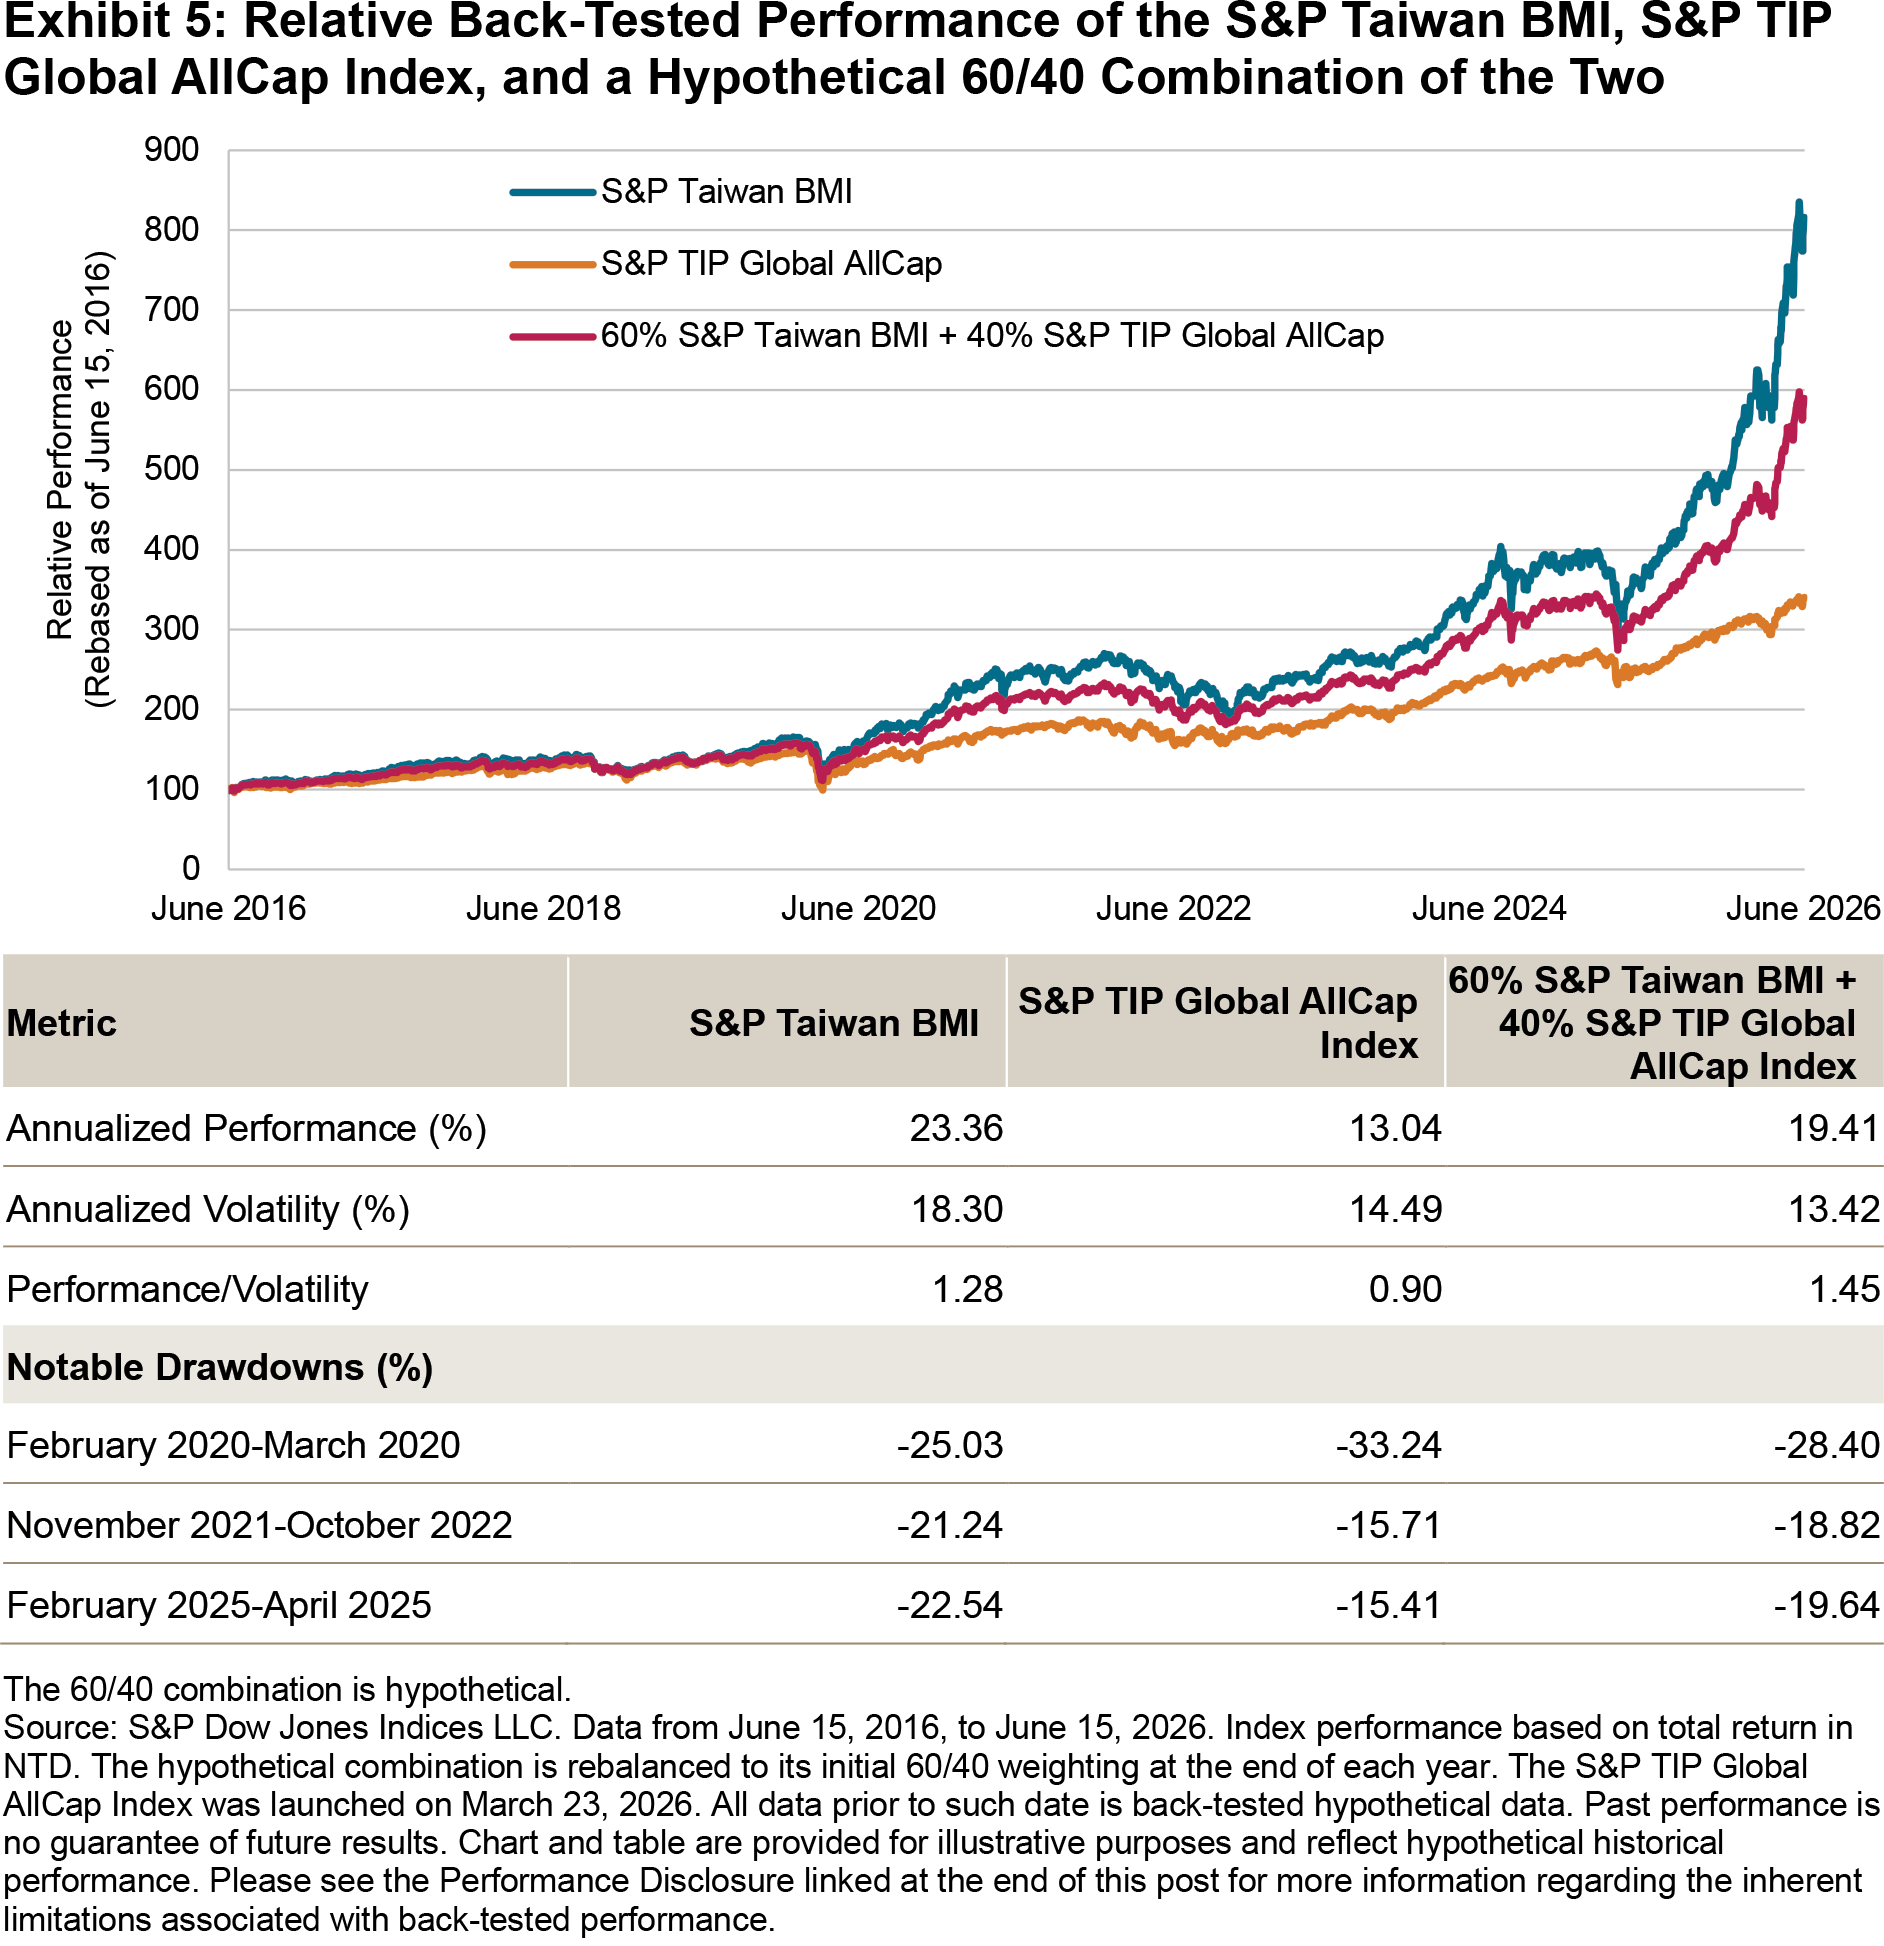
Over the past decade, the S&P Taiwan BMI has outperformed the S&P TIP Global AllCap Index on both an absolute and risk-adjusted basis. However, diversification coincided with an improved balance between performance and risk. For example, a hypothetical blend of 60% S&P Taiwan BMI and 40% S&P TIP Global AllCap Index would have delivered stronger risk-adjusted performance than either individual index over the period studied (see Exhibit 5). This hypothetical back-tested analysis shows the historical effects of combining a Taiwan equity-focused index with a more globally diversified index: lower volatility while preserving much of the performance. The hypothetical 60/40 blend’s smaller pullbacks during recent market downturns in 2021-2022 and 2025 further highlight the diversification effects.
To learn more, check out our recent piece, “TalkingPoints: Measuring Global Equity Beta with the S&P TIP Global AllCap Index.”
1 The index is owned by S&P Dow Jones Indices, with the Taiwan Index Plus Corporation (TIP) serving as the local partner in the Taiwanese market. See the S&P TIP Global All Cap Index Methodology for more details on the index construction.
This content may be AI-assisted and is composed, reviewed, edited, and approved by S&P Global.
The posts on this blog are opinions, not advice. Please read our Disclaimers.