Get Indexology® Blog updates via email.

In This List

Weighting in the Wings: Equal Weight in a Mega-Cap World

SPIVA Insights: Key Findings in the Middle East

Tech Tonics

A Comprehensive Measure for Identifying Shareholder Value: The S&P 500 Resilient Shareholder Yield Index

Navigating Global Markets with the S&P World Index

Weighting in the Wings: Equal Weight in a Mega-Cap World

Contributor Image
Florence Chapman

Senior Analyst, U.S. Equities

S&P Dow Jones Indices

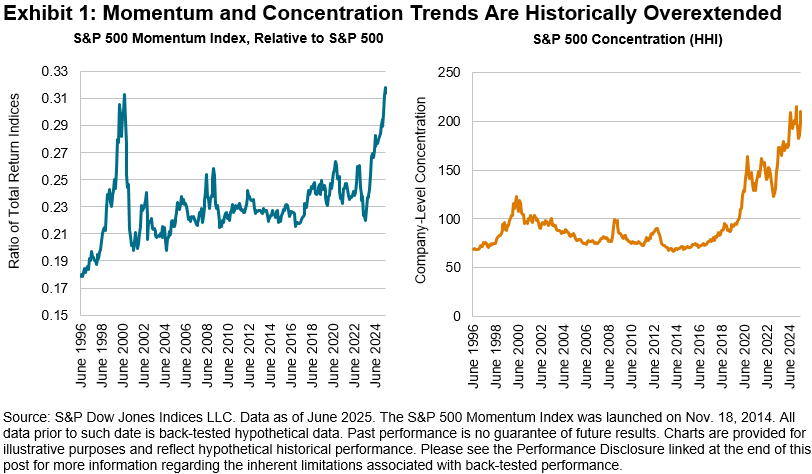
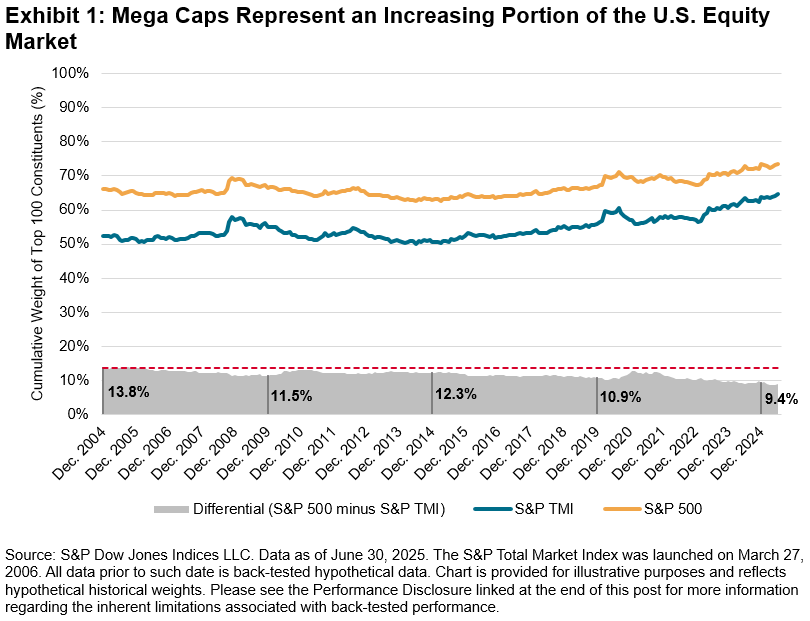
In today’s equity market, mega-cap stocks are not just influential—they have become a driving force shaping overall performance and strategic market dynamics.1 The increasing market dominance of the top 100 constituents, and the narrowing differential in cumulative weights of these names, in both the S&P Total Market Index (TMI)—which tracks the broad U.S. equity market—and the S&P 500® highlights this shift (see Exhibit 1).

The S&P 100 is designed to measure the performance of large-cap U.S. companies from The 500™ and comprises 100 blue-chip companies across multiple industry groups, offering a focused view of this robust and sizable segment of the market. The index’s construction follows a transparent and systematic approach to include the largest companies by total market capitalization. Generally, the largest companies in The 500 that have listed options are selected for inclusion into the S&P 100, and constituent selection is at the discretion of the Index Committee.2

While mega-cap names have historically driven substantial and sustained market growth, led particularly by gains in the Information Technology sector,1 their increasing market concentration may present challenges. Equal-weight strategies can potentially help manage concentration risk by enhancing diversification through a more even weight across the segment, reducing reliance on a handful of dominant names and better reflecting gains when performance is more broadly distributed.3

The S&P 100 Equal Weight Index

The S&P 100 Equal Weight Index (EWI) is the equal-weight version of the S&P 100. The index has the same constituents as its capitalization-weighted benchmark, but each company is assigned an equal weight at each quarterly rebalance. Constituent changes to the equal weight index are incorporated alongside the S&P 100. If a company is added between rebalances, it generally takes the weight of the company that it replaced.2

Why the S&P 100 EWI Matters

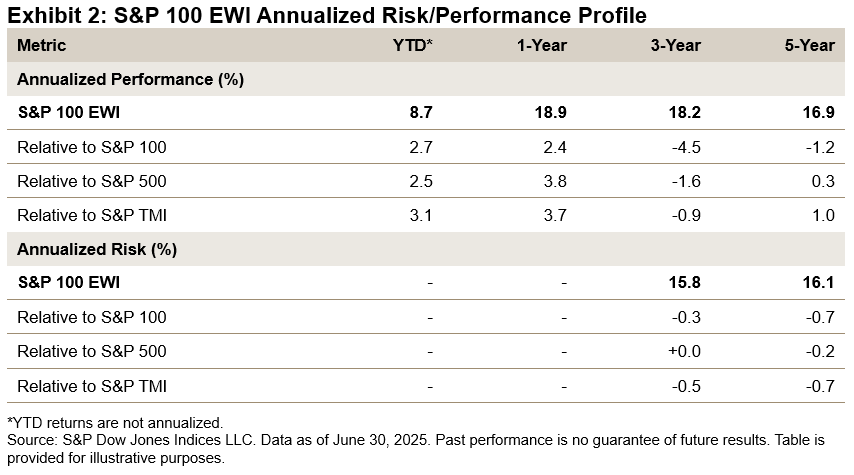
As of June 30, 2025, the S&P 100 EWI outperformed the market-cap-weighted S&P 100, S&P 500 and S&P TMI on a YTD and one-year basis (see Exhibit 2).

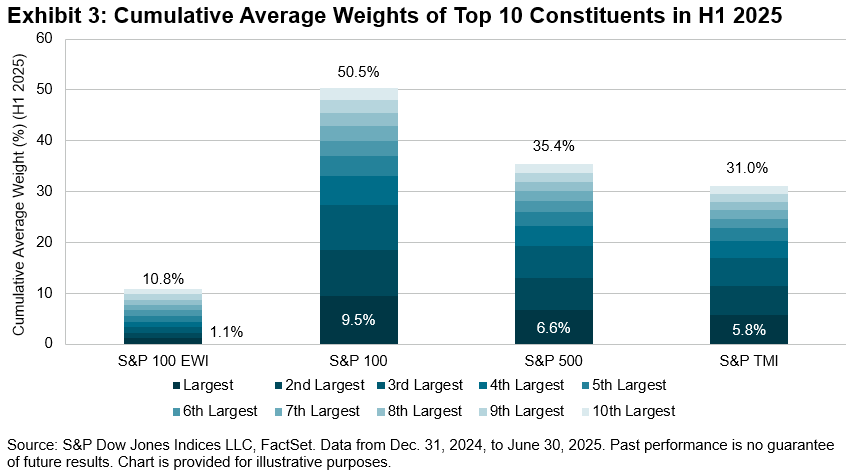
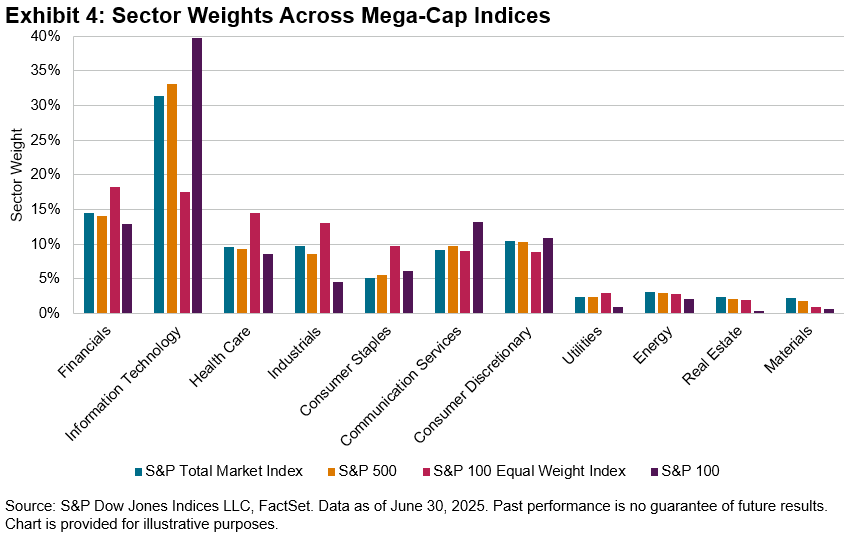
The divergence in performance between the S&P 100 EWI and market-cap-weighted indices highlights the impact of index construction. While the S&P 100 EWI offers balanced participation from all 100 companies, regardless of size, the market-cap-weighted S&P 100—along with The 500 and S&P TMI—tend to concentrate more heavily in the largest stocks (see Exhibit 3). Closely linked to this is the variation in sector composition between the indices. As of June 30, 2025, the S&P 100 EWI had comparatively lower weight in mega-cap Information Technology companies and higher weights in Financials, Health Care and Industrials (see Exhibit 4).

Conclusion

By providing an equal-weighted measure of the largest 100 U.S. companies, the S&P EWI offers a more balanced perspective on mega-cap performance. Accompanied by reduced concentration in top-heavy mega-cap names and broader sector views, it has outperformed its market-cap-weighted counterparts over recent periods. For market participants seeking a more diversified approach within the mega-cap segment, the S&P 100 Equal Weight Index may serve as a useful complement to traditional benchmarks.


1 Wang, Fei, “Exploring the U.S. Mega-Cap Landscape,” S&P Dow Jones Indices, April 2, 2025.

2 For more information, see the S&P U.S. Indices methodology.

3 See Edwards, Tim, et al. “Worth the Weight,” S&P Dow Jones Indices. July 23, 2024.

The posts on this blog are opinions, not advice. Please read our Disclaimers.

SPIVA Insights: Key Findings in the Middle East

How do active managers stack up to passive benchmarks in the Middle East? S&P DJI’s Tim Edwards joins GCMA’s Michael Grifferty for a closer look at the latest SPIVA MENA results and explores what’s driving the growth of passive in the region. 

The posts on this blog are opinions, not advice. Please read our Disclaimers.

Tech Tonics

Contributor Image
Anu Ganti

Head of U.S. Index Investment Strategy

S&P Dow Jones Indices

U.S. equities have staged a remarkable recovery in the past few months, shrugging off inflation concerns, trade tensions and geopolitical risks, all of which has culminated in multiple all-time highs. Meanwhile, the significant outperformance of the momentum factor, or the continued strength of winning stocks, coupled with the dominance of a few mega-cap companies, especially within the Technology sector, can lead to concentration, valuation and reversal concerns.

Illustrating these extended price and concentration trends, the left-hand side of Exhibit 1 shows that the S&P 500 Momentum Index’s cumulative relative outperformance has reached levels last seen during the height of the 90’s dot-com bubble, which was notably followed by a sharp reversal. The right-hand side of Exhibit 1 shows that the U.S. equity market is also unusually concentrated, as measured by the Herfindahl-Hirschman Index (HHI),1 a widely used concentration measure.

The Tech sector has been a prominent showcase of these trends, currently making up 33% of the S&P 500® and 22% of the S&P 500 Momentum Index’s weight. The S&P 500 Information Technology sector outperformed the S&P 500 by 13% in Q2, most recently capped by Nvidia’s milestone of becoming the first public company ever to reach a USD 4 trillion market capitalization.2

The Tech sector’s current adjusted HHI3 level of 9.3 indicates an extreme level of concentration for the sector compared to the long-term average of 5.2, consistent with what was observed for the broader market. As Exhibit 2 shows, when concentration has been relatively high in the past, it has subsequently tended to decline.

But for market participants seeking an index that measures Tech that simultaneously mitigates the concerns noted earlier, an equal-weight approach to large-cap Tech may be of particular interest. Exhibit 3 shows that the S&P 500 Equal Weight Information Technology Index, by rebalancing on a quarterly frequency, has a stronger tilt to small size, away from momentum and toward value compared to its cap-weighted peer (using the modified capitalization-weighted Technology Select Sector Index) relative to the S&P 500. These factor weights, while not static, are broadly consistent with the underlying S&P 500 Equal Weight Index’s factor profile, of which the smaller size and anti-momentum biases in particular have driven the index’s long-term outperformance.

The tendency of the momentum factor and Tech concentration to reverse may have important implications for the performance of equal-weight sector strategies. Exhibit 4 illustrates the relationship between the Tech sector’s adjusted HHI with the relative performance of the S&P 500 Equal Weight Information Technology Index compared with its cap-weighted counterpart. Although equal-weighted Tech has underperformed recently, typically, after peaks in concentration (such as during 1990, 1999 and 2002), the strategy has outperformed.

With Technology concentration at historically high levels along with broader momentum trends, it could be an interesting time to examine equal weighting within the sector as concentration and momentum have tended to mean-revert historically. Various index-weighting options are available for market participants to track specific market segments, and understanding concentration from a sector perspective may be critical to weighting these compositions appropriately.

The author would like to thank Nicholas Demers for his contributions to this post.

1 https://fraser.stlouisfed.org/files/docs/publications/FRB/pages/1990-1994/33101_1990-1994.pdf

2 https://www.reuters.com/business/finance/nvidias-4-trillion-milestone-caps-rise-stock-market-behemoth-2025-07-09/

3 In order to use the HHI to make comparisons within the Technology sector over time, we use an adjusted HHI, defined as the sector’s HHI divided by the HHI of an equal-weighted portfolio with the same number of stocks.

The posts on this blog are opinions, not advice. Please read our Disclaimers.

A Comprehensive Measure for Identifying Shareholder Value: The S&P 500 Resilient Shareholder Yield Index

Contributor Image
Elizabeth Bebb

Director, Factor & Dividend Indices

S&P Dow Jones Indices

By aggregating a company’s dividends, net buybacks and net debt reduction, shareholder yield provides a comprehensive measure for identifying companies that return the most value to their shareholders. The S&P 500® Resilient Shareholder Yield Index tracks 100 companies from the S&P 500 universe that exhibit high shareholder yields and strong fundamentals relative to their peers. The index was launched Dec. 2, 2024.

Methodology

The S&P 500 Resilient Shareholder Yield Index’s methodology begins with an inclusion criterion requiring companies to have a positive shareholder yield of 25% or less. This helps ensure that the index avoids companies with high yields that may indicate structural issues or financial weakness.

Subsequently, a composite z-score is calculated using four metrics: two quality indicators—return on equity (ROE) and free cash flow (FCF) to debt—and two metrics that assess the company’s ability to deliver consistent long-term shareholder returns: high shareholder yield and high capital return growth. The index weights its constituents based on their float market capitalization (FMC) multiplied by their shareholder yield.

Performance

Historical back-tested performance shows that the S&P 500 Resilient Shareholder Yield Index has outperformed its benchmark over the long term, posting a strong risk-adjusted return of 0.75 compared to 0.52 for the benchmark (see Exhibit 3). The index has historically demonstrated defensive characteristics, as evidenced by its reduced volatility and a lower downside capture ratio of 81.19%. Additionally, this back-tested data shows that the index has offered a higher dividend yield than the broader S&P 500 across the analyzed time horizon, further enhancing its appeal to market participants seeking resilient returns.

Fundamental Attributes:

The value and defensive focus of the S&P 500 Resilient Shareholder Yield Index is demonstrated via its historically higher-than-benchmark dividend yield and low valuation metrics. As of June 30, 2025, it also had higher ROE and return on invested capital (ROIC) metrics than the benchmark, demonstrating its quality aspect.

Sector Weights

The S&P 500 Resilient Shareholder Yield Index currently tilts toward Information Technology, Industrials, Communication Services and Health Care. However, the weights have transitioned over time; historically, there were much higher concentrations in the Consumer Staples and Consumer Discretionary sectors and lower weights in Financials and Industrials.

Interestingly, the largest underweight versus the benchmark is currently in Information Technology, at -14.3%. The highest overweight is in Energy, at 9.01% (see Exhibit 5). This is a function of both the selection metrics and the 4.5% stock weight cap, which reduces the weight of the larger companies.

Performance Resilience across Varying Macroeconomic Conditions

While historical back-testing demonstrates the index’s downside protection and defensiveness, an analysis was conducted to assess its performance across four distinct macroeconomic environments characterized by varying growth and inflation rates. The results show that the S&P 500 Resilient Shareholder Yield Index exhibited the most significant outperformance in the Falling Growth and Rising Inflation environment, achieving an average monthly excess return of 0.57%.

Conclusion

The S&P 500 Resilient Shareholder Yield Index selects constituents that exhibit quality attributes and strong financial metrics, enabling them to deliver robust shareholder returns across various macroeconomic environments. Historical back-testing reveals strong risk-adjusted returns, defensive characteristics and enhanced dividend yield, underscoring the index’s historical resilience.

1   Free Cash Flow (FCF) is comprised of operating cash flow minus capital expenditure

2   Methodology is available at https://www.spglobal.com/spdji/en/documents/methodologies/methodology-sp-500-share-yield-indices.pdf

3 A Historical Perspective on Factor Index Performance across Macroeconomic Cycles – Education | S&P Dow Jones Indices

The posts on this blog are opinions, not advice. Please read our Disclaimers.

Navigating Global Markets with the S&P World Index

What sets the S&P World Index apart when it comes to tracking developed markets around the globe? Explore how extensive coverage, historical consistency, transparency and adaptability are helping global investors make more informed decisions as they seek to uncover opportunities and navigate risks across economic cycles. 

The posts on this blog are opinions, not advice. Please read our Disclaimers.