


What sets the S&P World Index apart when it comes to tracking developed markets around the globe? Explore how extensive coverage, historical consistency, transparency and adaptability are helping global investors make more informed decisions as they seek to uncover opportunities and navigate risks across economic cycles.
The posts on this blog are opinions, not advice. Please read our Disclaimers.Navigating Global Markets with the S&P World Index
Introducing the S&P Thematics Dashboard: Transforming Data into Thematic Intelligence
Introducing the S&P 500 GARP 100 Index
Beyond Borders: Highlighting Global Growth with Canadian Revenue Exposure Indices
An Index-Based Approach to Tax-Advantaged Long/Short
Navigating Global Markets with the S&P World Index
Introducing the S&P Thematics Dashboard: Transforming Data into Thematic Intelligence

Given the increased interest in thematic strategies that measure both cutting-edge technologies and the broader forces shaping the global economy, we’re launching the S&P Thematics Dashboard—a monthly resource that highlights key economic and market indicators that help put the performance of thematic indices into perspective. With data created in collaboration with Theia Insights, the dashboard provides monthly performance insights on over 200 themes, grouped by their most relevant megatrends, regions, sectors and style factors. By presenting data through multiple lenses, the dashboard makes it easier to see how themes are shaping megatrends and influencing sector performance, helping investors better grasp the connections between today’s themes and the long-term forces driving markets.
One Dashboard, Many Perspectives
The S&P Thematics Dashboard is designed to serve a wide range of market participants, recognizing that different groups require unique perspectives when measuring financial markets. Through this dashboard, we aim to answer three key questions: What broad trends are gaining momentum? Which disruptive themes are attracting growing attention from the market? And what relevant factors may be influencing theme performance?
Organized into key sections, the dashboard helps connect the dots on what’s driving performance within the thematic market:
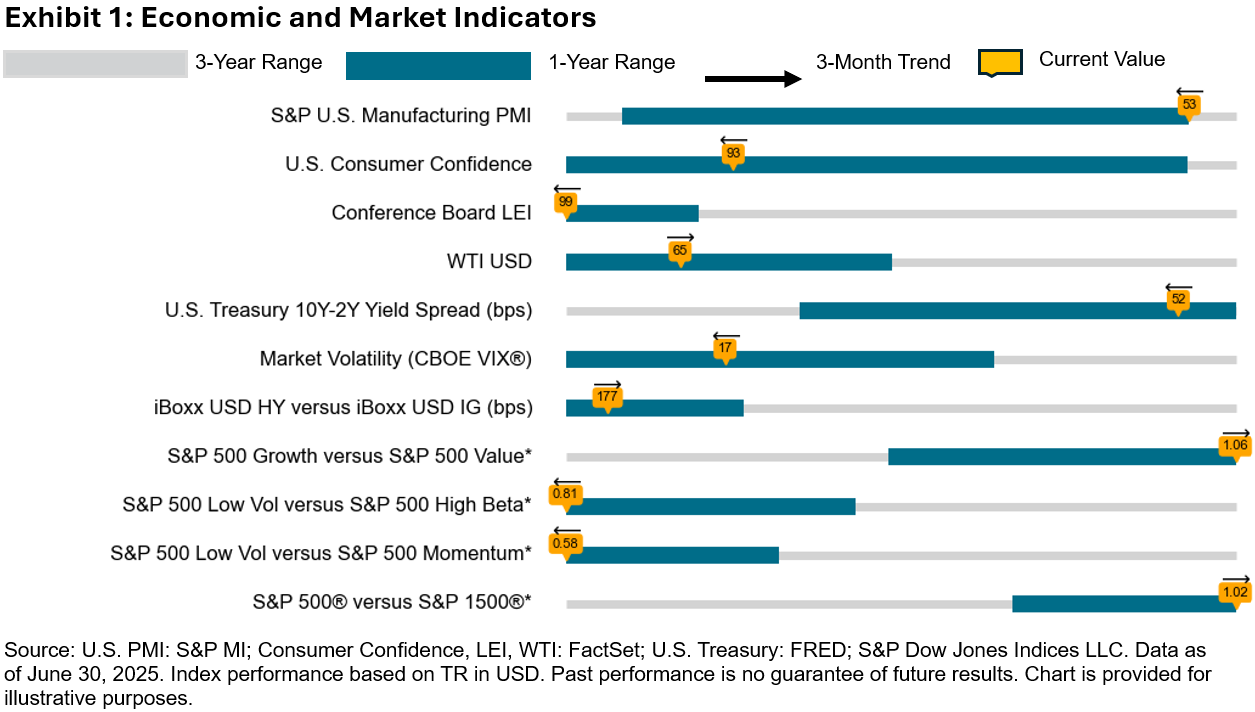
- U. S. Economic & Market Indicators: This section sets the macro and risk sentiment backdrop that is essential for understanding equity performance. Themes vary—from defensive to growth-oriented, domestic to global, and disruptive to mainstream. The macro and market indicators help identify how investor sentiment may impact different themes, positively or negatively.
- U.S. Market & GICS® Sector Performance: This section offers a snapshot of GICS sector performance across S&P Composite 1500® stocks. Since themes often align with GICS sector classifications, tracking sector dynamics provides important context—helping to identify whether a theme’s performance is driven by broader sector trends or by theme-specific factors.
- Theme Performance Split across Megatrends, Regions and Sectors: Themes are systematically categorized by their associated megatrend and sector, allowing for meaningful comparisons and providing a structure to understand performance of these 200+ themes. For each segment, the top and trailing three performing themes are displayed over multiple time periods. Breaking down thematic performance across these segments helps reveal regional leadership, sector-specific tailwinds and rotation patterns that might be hidden in aggregated returns.
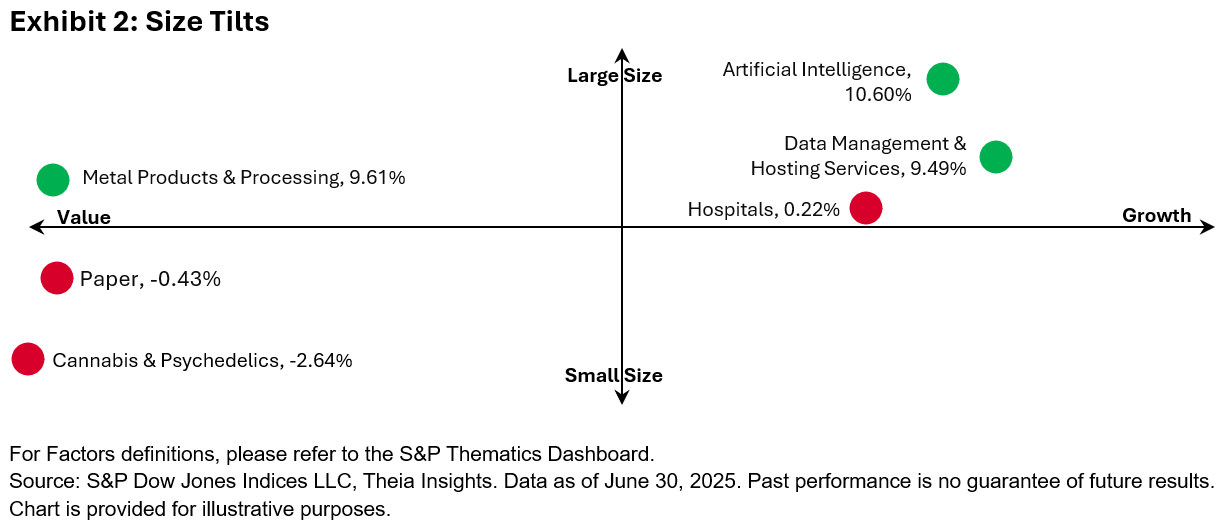
- Factor Tilt Quadrants: To measure underlying style tilts, themes are positioned within a two-dimensional chart based on their size (e.g., small cap versus large cap; see Exhibit 2) and style (e.g., value versus growth) tilts. Each quadrant reflects a different combination of factor characteristics, offering a clear contrast in factor tilts across themes. Recognizing and identifying such tilts helps avoid unintended clustering—such as overweight to small-cap growth—and supports more balanced, diversified thematic views.
- Risk/Return Analytics: Performance is only part of the picture—understanding risk is equally critical. This section presents two scatter plots that evaluate themes through a risk-adjusted lens: one mapping return against volatility, and the other plotting return against maximum drawdown. These visuals provide a clear view of risk/return profiles across themes.
- S&P Thematic Indices & S&P Kensho New Economies Indices: The final section rounds out the thematic landscape by presenting the performance of S&P DJI’s flagship thematic indices. The S&P Thematic Indices track broad structural trends such as climate transition, the digital economy and infrastructure, while the S&P Kensho New Economies target innovation-led, high-growth themes like AI, robotics and space—the building blocks of the Fourth Industrial Revolution.
In summary, the newly launched S&P Thematics Dashboard is a multi-lens tool that brings together macro, sector and thematic data into one comprehensive document, allowing going beyond a bird’s eye view of the economy to a granular look at performance of specific investment themes.
The posts on this blog are opinions, not advice. Please read our Disclaimers.Introducing the S&P 500 GARP 100 Index

- Categories Factors
- Tags factors, GARP, growth, multi-factor, quality, S&P 500 GARP 100 Index, value
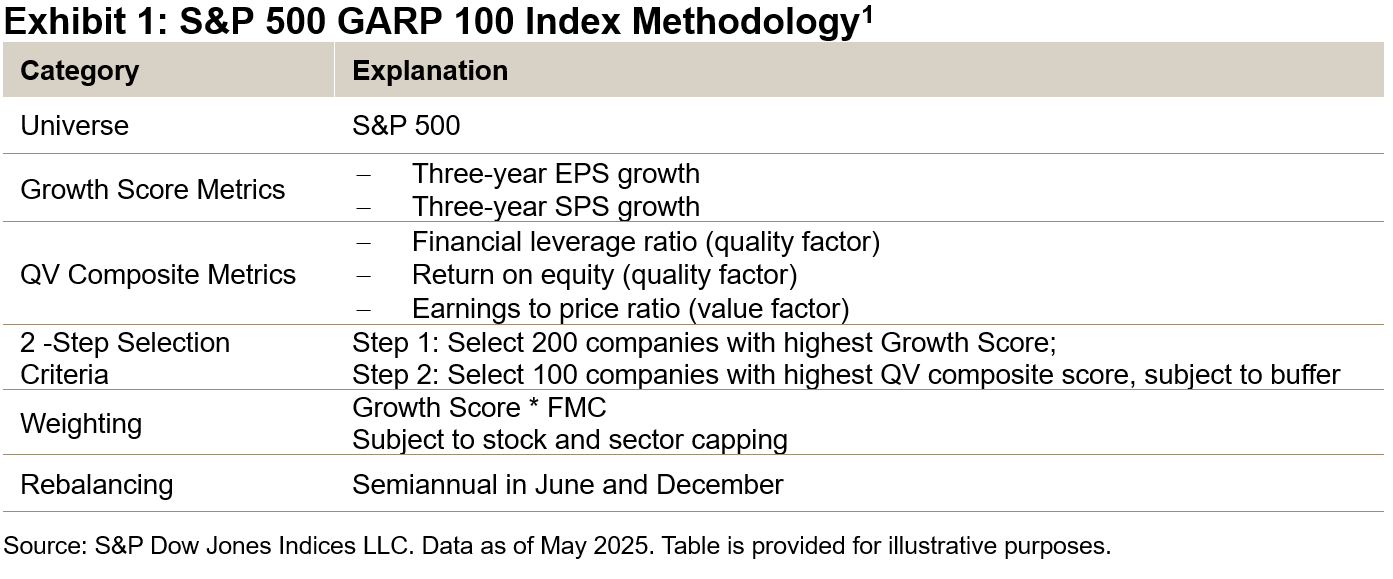
The S&P 500® GARP 100 Index, launched on Nov. 24, 2024, sits at the intersection of value and growth strategies. Its objective is to identify 100 constituents from the S&P 500 that exhibit strong growth while maintaining reasonable valuations and high quality attributes.
Methodology
The index employs a two-step selection process. First, it identifies the top 200 ranked constituents based on their Growth Score, which is derived from three-year earnings per share (EPS) and sales per share (SPS) growth rates. From this subset, the top 100 companies are selected using a composite score that integrates quality and value (QV) metrics.
Weighting within the index is determined by multiplying the Growth Score by each security’s free-float market capitalization (FMC).
Historical Back-Tested Performance Analysis
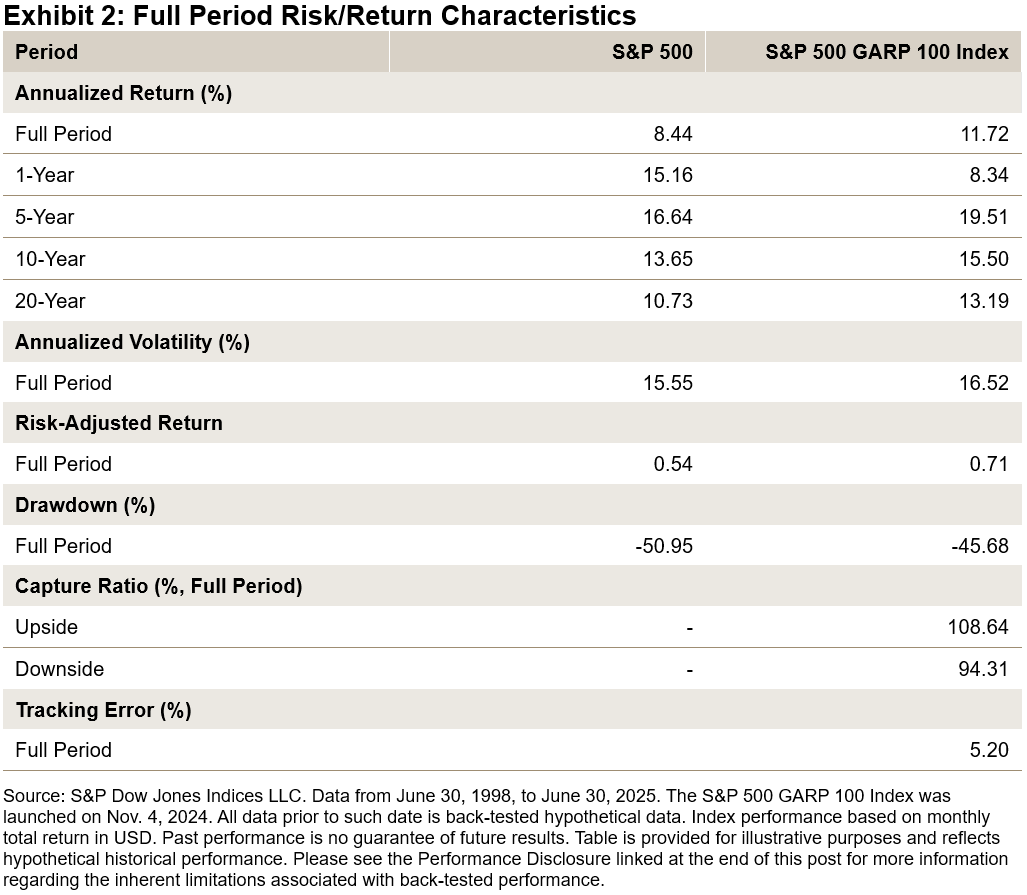
The historical back-tested performance of the S&P 500 GARP 100 Index shows significant outperformance, both in absolute and risk-adjusted terms, compared to its benchmark. The index exhibited an upside capture ratio of 108.53, highlighting its potential to benefit from rising markets. Conversely, a downside capture ratio of 94.31, along with a lower drawdown compared to the benchmark, underscores its moderate defensive characteristics.
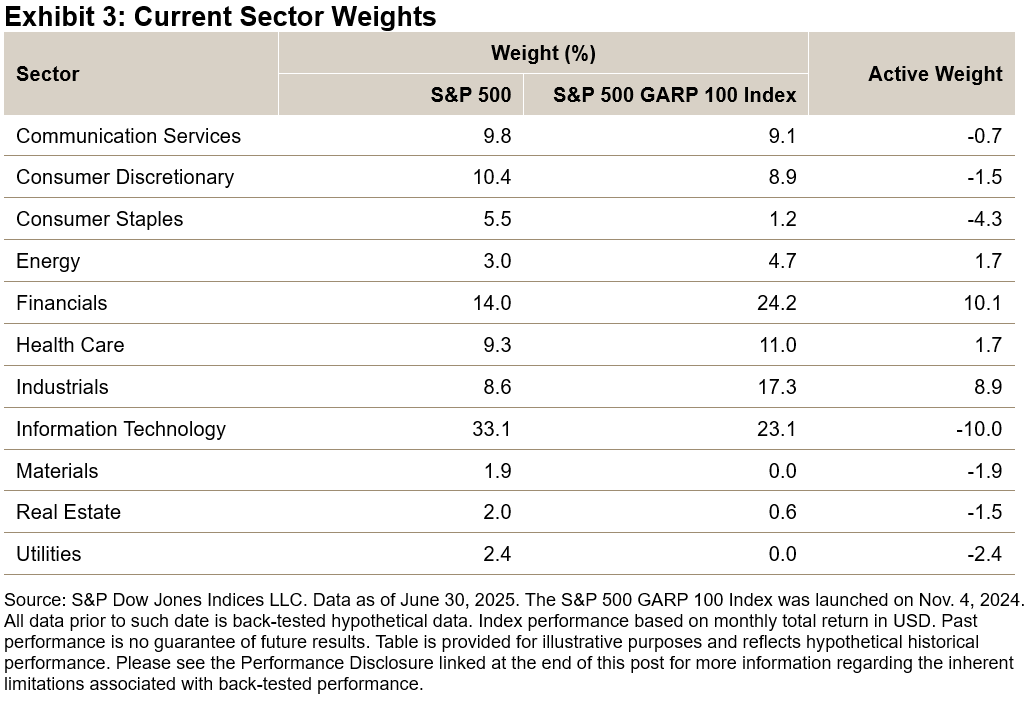
Sector Breakdown Insights
Exhibit 3 shows that as of June 30, 2025, the S&P 500 GARP 100 Index underweighted the Information Technology sector by about 10%, with Consumer Staples also underweight. The index had a high weight in Industrials and Financials. This is due to the multi-factor selection criteria of the methodology, which considers both growth and valuation metrics.
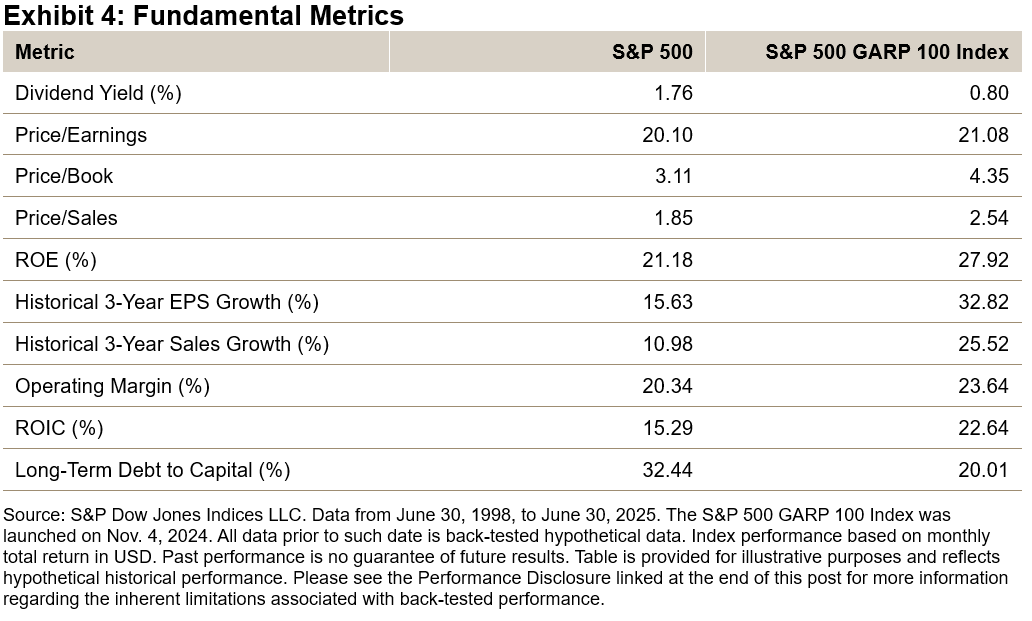
The S&P 500 GARP 100 Index has a multi-factor focus, having historically demonstrated strong fundamental characteristics across growth, value and quality metrics. Over the back-tested period, it exhibited significantly higher EPS and sales growth compared to the benchmark. Additionally, the index displayed strong quality metrics, including return on equity (ROE), return on invested capital (ROIC), operating margins and lower debt-to-capital ratios. Furthermore, the index featured lower price-to-earnings ratios, highlighting its emphasis on a lower valuation approach.
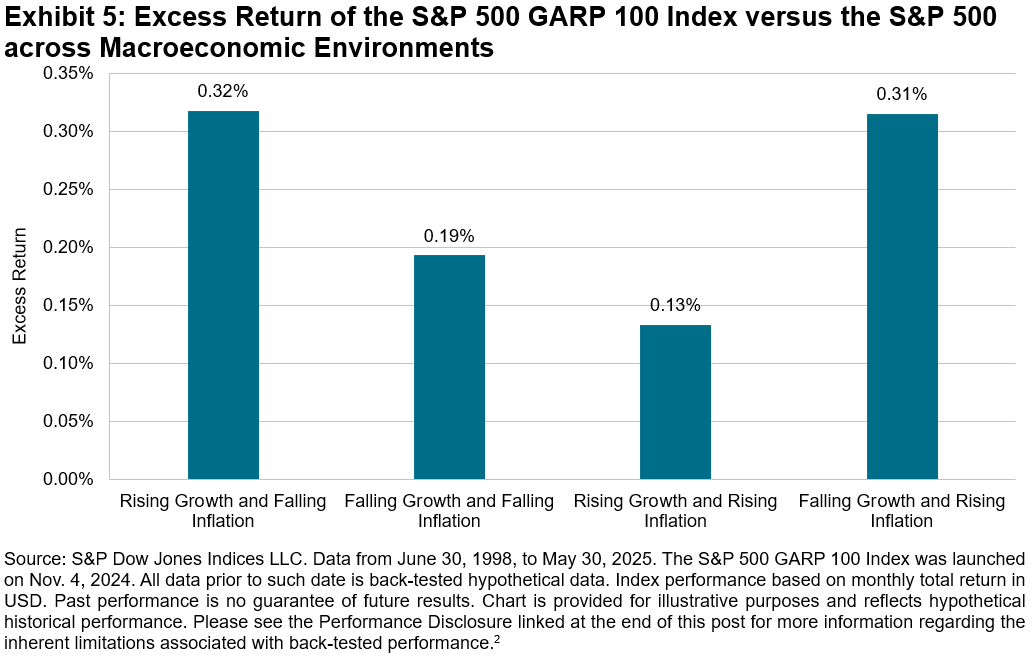
Historical Macroeconomic Performance
Exhibit 5 shows the monthly excess returns of the S&P 500 GARP 100 Index across various environments defined by rising and falling growth and inflation. Through its multi-factor approach, the index historically showed positive excess returns across each environment analyzed for this back-tested period.
Conclusion
The S&P 500 GARP 100 Index tracks companies within the S&P 500 that exhibit growth potential and strong valuations. Launched in November 2024, the index employs a rigorous multi-factor methodology that integrates growth, value and quality metrics. Back-tested historical performance analysis revealed significant outperformance against its benchmark, with defensive qualities and robust fundamentals.
1 For the full methodology rules, please refer to the S&P GARP Methodology Document.
2 For more information, please see: Hao, Bill and Rupert Watts. “A Historical Perspective on Factor Index Performance across Macroeconomic Cycles.” S&P Dow Jones Indices. Nov. 14, 2024.
The posts on this blog are opinions, not advice. Please read our Disclaimers.Beyond Borders: Highlighting Global Growth with Canadian Revenue Exposure Indices

In a globalized economy with tariff policies under the spotlight, understanding where companies generate their revenues has become increasingly important when it comes to asset allocation. The S&P/TSX Geographic Revenue Exposure Indices offer an innovative approach to measuring and tracking Canadian companies based on their revenue sources, whether primarily domestic or international. These indices provide market participants tools to make more informed decisions about their potential geographic exposure, while maintaining exposure to a domestic basket of listed Canadian companies.
As of May 30, 2025, the S&P/TSX 60 Canada Revenue Exposure Index had a strong tilt toward Canadian-sourced revenues, with approximately 78% of its revenue derived domestically. Meanwhile, the benchmark S&P/TSX 60 offered broader global diversification, with contributions from Europe, Asia and emerging markets. These distinctions provide market participants with targeted tools for aligning their regional revenue preferences with their global or domestic investment outlook.

Exhibit 2 highlights the dynamic nature of geographic revenue exposure and its influence on performance relative to the S&P/TSX 60. Over the past decade, the S&P/TSX 60 U.S. Revenue Exposure Index mostly outpaced the benchmark during periods of strong U.S. equity performance—notably during the post-COVID-19 recovery, when U.S.-listed companies with global tech and healthcare exposure rebounded sharply. More recently, shifting trade dynamics and industrial policy developments have begun to alter the landscape, contributing to renewed strength in Canadian revenue exposure. These patterns illustrate how revenue origin can serve as a useful lens through which to analyze index behavior across varying market environments.

The S&P/TSX 60 U.S. Exposure Index outperformed the benchmark over the past 1- and 3-year periods, albeit with higher volatility, while the S&P/TSX 60 Canada Revenue Exposure Index outperformed over the longer 5- and 10-year periods. These patterns suggest that domestically focused companies may provide more stable long-term returns, while companies with U.S. revenue exposure tend to lead during periods of U.S. market momentum.


While the S&P/TSX 60 reflects Canada’s large-cap equity landscape, its revenue-based counterparts reveal distinct sector tilts tied to geographic exposure. The S&P/TSX 60 Canada Revenue Exposure Index has leaned heavily into the Financials and Energy sectors, aligning with Canada’s domestic economic strengths. In contrast, the S&P/TSX 60 U.S. Revenue Exposure Index has been weighted more toward the Information Technology and Industrials sectors, which are often linked with international business and global demand.

The S&P/TSX 60 Geographic Revenue Exposure Indices highlight how differing revenue origins shape index characteristics. Global exposure has generally aligned more closely to market momentum shifts, while domestic exposure has tended to reflect long-term economic stability.
The posts on this blog are opinions, not advice. Please read our Disclaimers.An Index-Based Approach to Tax-Advantaged Long/Short
What’s the role of indices in long/short tax-advantaged strategies? Brooklyn Investment Group’s Erkko Etula joins S&P DJI’s Brandon Hass and Rupert Watts to explore how indices like the S&P 500 130/30 Quality Index are helping address concentration risk and demand for customization inclusive of long-term tax objectives via transparent design.
The posts on this blog are opinions, not advice. Please read our Disclaimers.