Given the increased interest in thematic strategies that measure both cutting-edge technologies and the broader forces shaping the global economy, we’re launching the S&P Thematics Dashboard—a monthly resource that highlights key economic and market indicators that help put the performance of thematic indices into perspective. With data created in collaboration with Theia Insights, the dashboard provides monthly performance insights on over 200 themes, grouped by their most relevant megatrends, regions, sectors and style factors. By presenting data through multiple lenses, the dashboard makes it easier to see how themes are shaping megatrends and influencing sector performance, helping investors better grasp the connections between today’s themes and the long-term forces driving markets.
One Dashboard, Many Perspectives
The S&P Thematics Dashboard is designed to serve a wide range of market participants, recognizing that different groups require unique perspectives when measuring financial markets. Through this dashboard, we aim to answer three key questions: What broad trends are gaining momentum? Which disruptive themes are attracting growing attention from the market? And what relevant factors may be influencing theme performance?
Organized into key sections, the dashboard helps connect the dots on what’s driving performance within the thematic market:
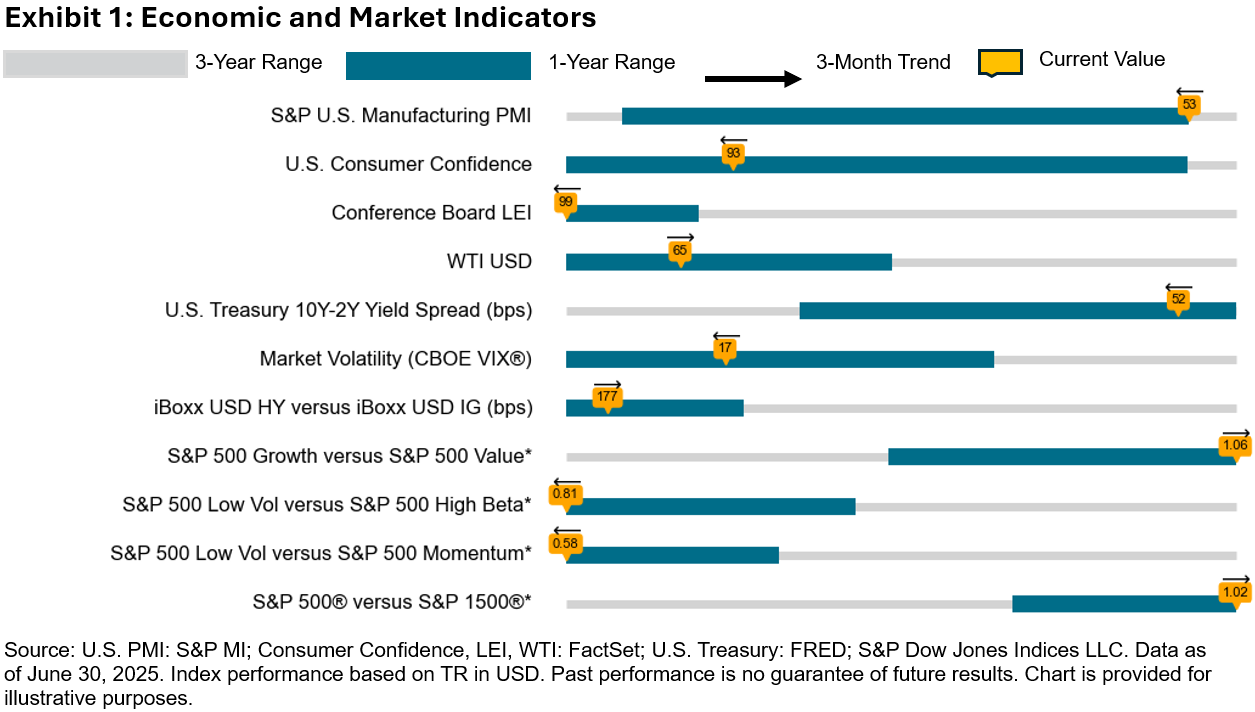
- U. S. Economic & Market Indicators: This section sets the macro and risk sentiment backdrop that is essential for understanding equity performance. Themes vary—from defensive to growth-oriented, domestic to global, and disruptive to mainstream. The macro and market indicators help identify how investor sentiment may impact different themes, positively or negatively.
- U.S. Market & GICS® Sector Performance: This section offers a snapshot of GICS sector performance across S&P Composite 1500® stocks. Since themes often align with GICS sector classifications, tracking sector dynamics provides important context—helping to identify whether a theme’s performance is driven by broader sector trends or by theme-specific factors.
- Theme Performance Split across Megatrends, Regions and Sectors: Themes are systematically categorized by their associated megatrend and sector, allowing for meaningful comparisons and providing a structure to understand performance of these 200+ themes. For each segment, the top and trailing three performing themes are displayed over multiple time periods. Breaking down thematic performance across these segments helps reveal regional leadership, sector-specific tailwinds and rotation patterns that might be hidden in aggregated returns.
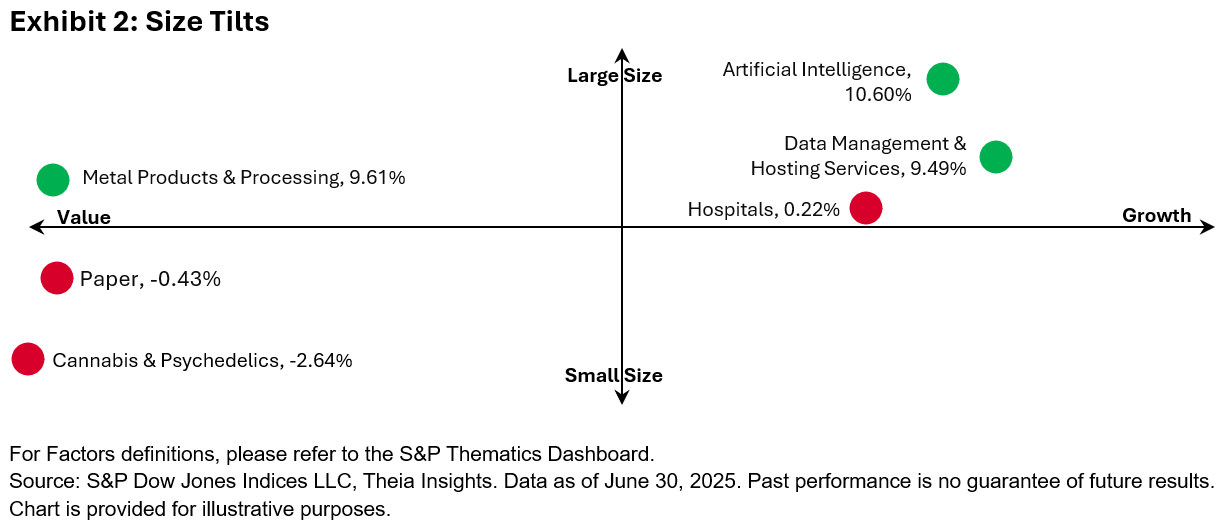
- Factor Tilt Quadrants: To measure underlying style tilts, themes are positioned within a two-dimensional chart based on their size (e.g., small cap versus large cap; see Exhibit 2) and style (e.g., value versus growth) tilts. Each quadrant reflects a different combination of factor characteristics, offering a clear contrast in factor tilts across themes. Recognizing and identifying such tilts helps avoid unintended clustering—such as overweight to small-cap growth—and supports more balanced, diversified thematic views.
- Risk/Return Analytics: Performance is only part of the picture—understanding risk is equally critical. This section presents two scatter plots that evaluate themes through a risk-adjusted lens: one mapping return against volatility, and the other plotting return against maximum drawdown. These visuals provide a clear view of risk/return profiles across themes.
- S&P Thematic Indices & S&P Kensho New Economies Indices: The final section rounds out the thematic landscape by presenting the performance of S&P DJI’s flagship thematic indices. The S&P Thematic Indices track broad structural trends such as climate transition, the digital economy and infrastructure, while the S&P Kensho New Economies target innovation-led, high-growth themes like AI, robotics and space—the building blocks of the Fourth Industrial Revolution.
In summary, the newly launched S&P Thematics Dashboard is a multi-lens tool that brings together macro, sector and thematic data into one comprehensive document, allowing going beyond a bird’s eye view of the economy to a granular look at performance of specific investment themes.
The posts on this blog are opinions, not advice. Please read our Disclaimers.