Get Indexology® Blog updates via email.

In This List

Green Bond Issuance: Setting Records

How Australian Dividend Investors Could Benefit from the Core-Satellite Approach

The EU Climate Transition and Paris-Aligned Benchmarks: A New Paradigm

Commodities in October – Waiting Patiently for a U.S.-China Trade Deal

Highlighting the S&P/BMV Index Series

Green Bond Issuance: Setting Records

Contributor Image
Kevin Horan

Former Director, Fixed Income Indices

S&P Dow Jones Indices

In June 2019, Reuters published that green bond issuance for the year had surpassed USD 100 billion,[1] which extolled a milestone of the first time the green bond issuance pace had reached the USD 100 billion mark by the first half of the year. Issuance could be on track to double by the end of the year. Since the end of June, USD 90 billion more has been issued, bringing the 2019 total to USD 212 billion in issuance as of October 2019.

When looking at country of issuance, the U.S. led national rankings, followed by France, China, Germany, and the Netherlands.

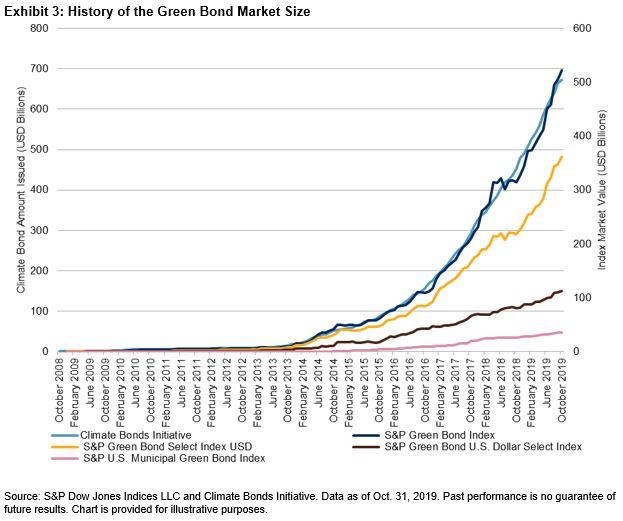
Derived from the same data, though organized for index use, the S&P Green Bond Index contains 5,774 bonds with a market value of USD 546 billion. Originally launched in 2014, the S&P Green Bond Index is a broad market index that is designed to measure the performance of green bonds regardless of size, coupon, or structure. The index and its subindices have grown in size as issuance has continued to increase for the green bond market.

Like the green bond market, the top countries in the S&P Green Bond Index are the U.S., France, and China, which make up 17%, 14%, and 9% of the index’s weight, respectively. The ratings within the index have transitioned from the historic AAA of supranational, which in the past consisted of heavy issuers of green bonds, to its current breakdown, seen in Exhibits 3 & 4.

The makeup of the issuers also shifted from supranational and short duration to longer-dated and larger sovereign and corporate bonds. The weighted average maturity of the S&P Green Bond Index went from 2.5 years in 2012 to 9.5 years in 2019, with a modified duration of 6.5 years.

Exhibit 6 compares the 1-, 3-, 5-, and 10-year returns of the S&P Green Bond Index, of which corporates was around 50% for the index and the market. Since the majority of credits for the index and the overall market were investment grade (80%), Exhibit 4 compares investment-grade corporates in USD terms.

Currently, the green bond market is small when compared to the overall fixed income market. Issuance continues to increase along with the diversity of issuers. The existence of the green bond market and the S&P Green Bond Index is a start, but if capital markets are to meet the needs of the environment and reversing the damages of climate change, the scale of investment capital would have to be exponentially larger in order to meet the challenge.

[1]   Learn more at the following link: https://www.reuters.com/article/us-bonds-environment/green-bond-issuance-surpasses-100-billion-so-far-this-year-data-idUSKCN1TQ11V.

The posts on this blog are opinions, not advice. Please read our Disclaimers.

How Australian Dividend Investors Could Benefit from the Core-Satellite Approach

Contributor Image
Izzy Wang

Senior Analyst, Factors and Dividends

S&P Dow Jones Indices

The core-satellite approach splits a portfolio into two parts: the main part, called the core, and a much smaller portion, called the satellite. The core generally consists of “boring” but steady long-term performance (often index funds tracking market portfolios), while the satellite can be anything that could complement the core with risk diversification, outperformance potential, or both. This way, you could have the benefits of a diversified portfolio, an opportunity to outperform the market, and the advantage of lower management and transaction costs.

For income-seeking investors with core holdings of market portfolios like the S&P 500 and the S&P/ASX 300, the S&P/ASX 300 Shareholder Yield Index and the S&P 500 Low Volatility High Dividend Index can be compelling satellite options for their attractive dividend yield and high active share.[1]

Attractive Dividend Yield

The trailing 12-month dividend yield averaged 5.02% for the S&P/ASX 300 Shareholder Yield Index from its launch in December 2014 to October 2019 (see Exhibit 1). The S&P 500 Low Volatility High Dividend Index also posted an impressive 4.11% average dividend yield from its launch in September 2012 to October 2019.

High Active Share

Since January 2015, the active share of the S&P/ASX 300 Shareholder Yield Index against the S&P/ASX 200 averaged 74%. For the S&P 500 Low Volatility High Dividend Index versus its benchmark, the number was 85%. This means that both indices could be more “active” than many active yield-focused funds offered in Australia and can complement a core index holding in an investor’s portfolio.

Implementing the Core-Satellite Approach with the Two Dividend Indices

If your core is the S&P/ASX 300 or the S&P 500, how would your portfolio look like if you moved some capital to the corresponding dividend index? Exhibits 2 and 3, which depict the risk/return profiles of 11 combinations of core and satellite, provide a visual illustration of the effects.

Over the past 15 years, a 100% S&P 500 portfolio generated 8.9% annual total return, with 12.3% annualized volatility (in AUD; see Exhibit 2). When the allocation moved to the S&P 500 Low Volatility High Dividend Index by 10%, 20%, 30%, etc., the risk/return point moved toward the top left of the original portfolio, which means higher return and lower risk. For example, at the 50/50 allocation, the total return increased 80 bps to 9.7% per year and volatility decreased to 11.8%.

Similarly, moving capital from an S&P/ASX 300 core holding to the S&P/ASX 300 Shareholder Yield Index could also improve portfolio risk/return (see Exhibit 3).

The curves in Exhibits 2 and 3 reveal how diversification improves a portfolio’s risk/return profile, or what is called the “efficiency” of portfolios. It could be used as a guide to help investors implement the core-satellite approach.

[1] Wang, Izzy and Tianyin Cheng, 2019, TalkingPoints: The S&P/ASX 300 Shareholder Yield Index.

The posts on this blog are opinions, not advice. Please read our Disclaimers.

The EU Climate Transition and Paris-Aligned Benchmarks: A New Paradigm

Contributor Image
Ben Leale-Green

Former Associate Director, Research & Design, ESG Indices

S&P Dow Jones Indices

Since the release of the Intergovernmental Panel on Climate Change (IPCC) report[1] in October 2018, there has been growing investor interest in 1.5οC scenario-aligned portfolios. In May 2018, the EU announced its action plan for sustainable finance, which included proposals to create two new carbon transition benchmarks (EU Climate Transition [CTB] and Paris-aligned Benchmarks [PAB]). The EU appointed a technical expert group (TEG) to report on the minimum standards for new benchmarks. On Sept. 30, 2019,[2] the TEG released its final report on benchmarks and benchmark ESG disclosures. The report provides information regarding the preparation of the delegated acts by the European Commission, which will be published in draft form before the end of the year. What is the likely effect of the TEG’s proposals on indices?

Consistent tracking error over time is commonplace for ESG indices, due to their design. However, new EU proposals on climate benchmarks[2] make the CTB and PAB active risk dependent on the parent index’s ability to meet their 7% year-on-year decarbonization trajectory (which is the linear decarbonization required for a 1.5οC scenario), due to absolute carbon intensity reductions rather than relative.[3] Therefore, tracking error will be driven by the parent index, which is outside of the control of CTB or PAB. This is not good or bad, in essence, but is a new paradigm for investors if they want to invest in CTB- or PAB-aligned products.

Exhibit 1 shows future PAB and CTB trajectories, as well as a range of possible trajectories from 7% decarbonization and 3% carbonization of the index (the first chart). Here it can be seen how much market trajectory divergence from a 1.5οC scenario could affect the index’s future Weighted Average Carbon Intensity (WACI). The second chart in Exhibit 1 shows the potential future carbon intensity reduction required to align with the TEG’s proposals for the CTB and PAB.

If the parent index decarbonizes at 7%, the level proposed in the TEG report, both the CTB and PAB would keep their initial level of percentage reduction, at 30% and 50%, respectively. However, if the parent index does not decarbonize at such a rate, the carbon intensity reduction would increase over time.

Due to the high skew of 17 for companies’ carbon intensity, (see Exhibit 2) the carbon intensity reduction and resulting active share of the CTB and PAB do not have a linear relationship. Achieving the initial 30% or 50% reduction does not require a large active share, as heavily underweighting or excluding the most carbon intensive companies would drastically reduce the WACI. However, active share would increase exponentially as carbon intensity reduction requirements rise and other constraints are incorporated.

These carbon intensity reductions are the absolute minimum needed to meet the TEGs proposals for CTBs or PABs. Therefore, reduction targets will likely have to be larger than the required reduction to ensure the PAB and CTB have sufficient leeway when weight drift affects the index’s WACI.[4]

In recent years, the S&P Global LargeMidCap’s WACI has trended downward (see Exhibit 3), however, there have been fluctuations.[5] Due to the high concentration in carbon intensity in a few companies, their performance, and therefore weight in market-cap-weighted indices, is a large driver of an index’s WACI. Therefore, if the most carbon-intensive companies outperform, the WACI will increase significantly.

Overall, there are various carbon intensity trajectories market-cap-weighted indices can take, which would affect the level of active share required of indices to meet the TEG’s propsals for CTBs and PABs. As the proposed requirements of carbon reduction from the parent index increase, the active risk taken could rise expotentially due to the high positive skew in the distribution of corporates carbon intensity. This absolute emission target, as opposed to a relative emission reduction, is a new paradigm for index design.

[1] IPCC, 2018: Global warming of 1.5°C. An IPCC Special Report on the impacts of global warming of 1.5°C above pre-industrial levels and related global greenhouse gas emissions pathways, in the context of strengthening the global response to the threat of climate change, sustainable development, and efforts to eradicate poverty [V. Masson-Delmotte, P. Zhai, H. O. Pörtner, D. Roberts, J. Skea, P.R. Shukla, A. Pirani, W. Moufouma-Okia, C. Péan, R. Pidcock, S. Connors, J. B. R. Matthews, Y. Chen, X. Zhou, M. I. Gomis, E. Lonnoy, T. Maycock, M. Tignor, T. Waterfield (eds.)]. In Press.

[2] The EU Technical Expert Group on Sustainable Finance. (2019). TEG Final Report on Climate Benchmarks and Benchmarks’ ESG Disclosures. https://ec.europa.eu/info/sites/info/files/business_economy_euro/banking_and_finance/documents/190930-sustainable-finance-teg-final-report-climate-benchmarks-and-disclosures_en.pdf.

[3] The current norm for indices is to seek a relative change from the benchmark. However, under the proposals of the TEG, the index provider shall set their 30 % (for the CTB) and 50% (for the PAB) reduction anchor, then set the trajectory line for the decarbonization of the CTB and PAB. As a result, the CTB and PAB make an absolute level of reduction, rather than a relative one.

[4] The WACI has to be calculated using average weights over the period, according to the TEG’s proposals.

[5] The S&P Global LargeMidCap’s carbon intensity has not been adjusted for inflation as the proposed in the TEG’s report. Therefore, when adjusted for inflation, the slope would have less of a negative trajectory.

The posts on this blog are opinions, not advice. Please read our Disclaimers.

Commodities in October – Waiting Patiently for a U.S.-China Trade Deal

Contributor Image
Fiona Boal

Managing Director, Global Head of Equities

S&P Dow Jones Indices

The broad commodities market rose modestly in October. The S&P GSCI was up 1.2% for the month and up 10.0% YTD. The Dow Jones Commodity Index (DJCI) was up 1.9% in October and up 6.7% YTD. Gains were spread surprisingly evenly across the individual commodity markets

As has been the case all year, the star performer in the petroleum complex in October was gasoline; the S&P GSCI Gasoline was up 5.2% for the month, driven by unscheduled refinery outages in the U.S. as opposed to particularly strong consumer demand. Despite a brief pick up in prices in October (S&P GSCI Natural Gas up 3.6%), the natural gas market remains mired in oversupply, with production growth continuing to outpace domestic consumption and export opportunities. U.S. natural gas stocks have pushed above the five-year average despite lower prices and a sharp drop in the number of rigs drilling for gas.

As the annual LME Week in London came to an end, the majority of metals across the industrial complex ended higher in October on the back of trade war resolution hopes and labor strikes in Chile. The two exceptions were S&P GSCI Iron Ore and the S&P GSCI Nickel, which were down 5.9% and 2.1%, respectively, but both were still up near 60% YTD. Nickel mines in Indonesia agreed on Oct. 28, 2019, to stop nickel ore exports immediately, pulling forward the already expedited January 2020 deadline. After nickel prices moved higher by 24% in August, a period of consolidation is understandable.

Palladium outperformed in the precious metals space in October on the back of a glaring supply shortfall. The platinum to palladium ratio is at the lowest in the last 25 years, reflecting the strength of the palladium market; the S&P GSCI Palladium was up a solid 6.7% in October and up 50.4% YTD. The S&P GSCI Gold continued its slow march higher, adding 3.0% on the month and up 17.6% YTD, driven higher by catalysts such as the U.S. Fed’s third rate cut and the Diwali festival in India.

The agriculture complex continues to wait patiently for positive news on the U.S.-China trade war front. The S&P GSCI Agriculture was up 1.4% in October. China has been back in the U.S. soybean market, although to a lesser degree than before the trade war, but the two countries are still finalizing a “Phase 1” trade pact that many expect will boost U.S. agriculture exports to China, particularly soybeans. The S&P GSCI Cotton ended the month up 6.1% on concern regarding the condition of the U.S. crop due to poor weather during harvest. The newly launched S&P GSCI Skim Milk Powder also ended the month in positive territory, up 5.1%, continuing to benefit from strong global milk powder demand.

It was a mixed bag in the livestock sector in October; S&P GSCI Lean Hogs was down 9.0% while S&P GSCI Live Cattle rose 6.4%. Volatility in the lean hog market continues, as market participants flip between focusing on the devastating supply cuts caused by African swine flu in China and the export-depleting drag of the ongoing U.S.-China trade war.

The posts on this blog are opinions, not advice. Please read our Disclaimers.

Highlighting the S&P/BMV Index Series

Contributor Image
Maria Sanchez

Director, Sustainability Index Product Management, U.S. Equity Indices

S&P Dow Jones Indices

The S&P/BMV Index Series combines the local market expertise of the Mexican Stock Exchange (the BMV) with the resources and reach of one of the most prominent independent global index providers, S&P Dow Jones Indices (S&P DJI). This productive collaboration officially began in May 2015 and adheres to international standards. The relationship also provides the opportunity to create new indices across different asset classes in the Mexican market.

The S&P/BMV Indices cover:

  • Equities: Mexico’s flagship index is the S&P/BMV IPC, with additional indices spanning across sectors, strategies, and sizes.
  • Fixed Income: Indices in this category range from tracking sovereign bonds to corporate bonds, offering different ratings based on maturities, coupon types, and currencies, as well as nominal and inflation-linked securities.
  • Volatility: The S&P/BMV IPC VIX is designed to measure the implied 90-day volatility of the Mexican stock market.
  • Multi-Asset: The S&P/BMV Mexico Target Risk Index Series comprises strategy indices that represent stock and bond allocations across a risk spectrum spanning from conservative to aggressive.

We are constantly designing new indices to serve as innovative and practical tools for local and global investors. To ensure the indices are replicable and investable, we incorporate feedback from market participants. Over the past four years, we have launched a complete suite of single-factor indices. More recently, we debuted the first multi-factor strategy, the S&P/BMV IPC Quality, Value & Growth Index. These indices could serve as the basis for financial products like ETFs, among others, to be incorporated into portfolio strategies.

In our commitment to ESG, S&P DJI has collaborated with the Consejo Consultivo de Finanzas Verdes (CCFV). This council aims to promote the financing of green projects and generate common sustainability standards for market practices in Mexico. Together, S&P DJI and the BMV selected SAM, a highly reputable Swiss investment specialist focused exclusively on sustainable investing, as the official score provider for the development of ESG-based S&P/BMV Indices.

In the ongoing global debate about active versus passive investment, S&P Dow Jones Indices has played a major role by publishing the SPIVA® and Persistence Scorecards for Latin America. These reports include historical performance measurements of actively managed equity mutual funds in Mexico compared with the S&P/BMV IPC[1] over different time horizons.

S&P Dow Jones Indices congratulates the BMV on its 125th anniversary. Our commitment to Mexico and the BMV is to continue working on new, innovative indices for the country’s markets.

For further information, visit our website: https://spdji.com/regional-exposure/americas/mexico.

[1] The reports measure the S&P/BMV IPC’s total return version, the S&P/BMV IRT.

The posts on this blog are opinions, not advice. Please read our Disclaimers.