Get Indexology® Blog updates via email.

In This List

S&P and Dow Jones Islamic Market Indices Largely Outperformed Conventional Indices in Q2 2019

S&P China 500 Declined 2.8% in Q2 2019; Gains Stood at 20.2% YTD

The Opportunity Cost of Active Management

Carlos Urzúa Resignation and Low Volatility’s Response

Palladium – All That Glitters Is Not Gold

S&P and Dow Jones Islamic Market Indices Largely Outperformed Conventional Indices in Q2 2019

Contributor Image
John Welling

Director, Global Equity Indices

S&P Dow Jones Indices

Developed Market Indices Continued to Outperform Conventional Indices, Emerging Markets Lagged

Global S&P and Dow Jones Shariah-compliant benchmarks outperformed their conventional counterparts YTD in 2019, as Information Technology—which tends to be overweight in Islamic indices—has been a sector leader, while Financials—which is underrepresented in Islamic indices—continued to underperform the broader market. The S&P Global BMI Shariah and Dow Jones Islamic Market (DJIM) World gained 18.4% and 18.0% YTD, respectively, outperforming the conventional S&P Global BMI by approximately 200 bps.

 The outperformance trend played out across major regions as Shariah-compliant benchmarks measuring U.S., Europe, Asia Pacific, and developed markets each continued to outperform conventional equity benchmarks by meaningful margins. Emerging markets and the Pan Arab region were exceptions, as Shariah-compliant benchmarks in these regions underperformed their conventional counterparts.

U.S. Equities Led the Rest of the World through Q2 2019

Following robust gains in Q1 2019, positive U.S. equity performance continued throughout Q2 2019, leading conventional global equities YTD. A continued dovish stance from the U.S. Federal Reserve and hopes of relief in U.S.-China trade negotiations helped push U.S. equities higher last quarter. European and Asia Pacific equities followed in performance, as each enjoyed healthy gains over the period.

MENA Equities Underperformed – Country Results Varied

MENA equities, as measured by the S&P Pan Arab Composite, lagged marginally behind emerging market equities YTD, with a gain of 12.2%. Following robust Q1 2019 performance, the S&P Bahrain continued to lead the region YTD, with gains of 25.1%, followed by the S&P Egypt BMI, which added 22.0%. The S&P Saudi Arabia, which was promoted to emerging market status in March 2019, gained a favorable 15.9%. The S&P Oman lagged most, falling 2.6% YTD, followed by the S&P Qatar, which rose 1.6% YTD.

Varied Returns of Shariah-Compliant Multi-Asset Indices

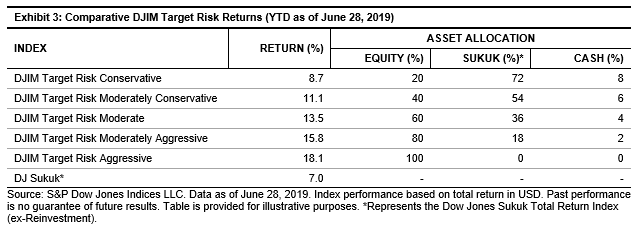
The DJIM Target Risk Indices—which combine Shariah-compliant global core equity, sukuk, and cash components—generally underperformed the S&P Global BMI Shariah and DJIM World YTD. Performance of the comparably more risk-averse DJIM Target Risk Conservative Index was constrained by its 20% allocation to global equities in the expanding market environment, and the index ultimately gained 8.7% YTD. Meanwhile, the performance of the DJIM Target Risk Aggressive Index was driven by its 100% allocation to a mix of Shariah-compliant global equities, with the index returning 18.1% YTD, in alignment with the broader S&P Global BMI Shariah and DJIM World.

For more information on how Shariah-compliant benchmarks performed in Q2 2019, read our latest Shariah Scorecard.

A version of this article was first published in Islamic Finance News Volume 16 Issue 27 dated July 10, 2019.

The posts on this blog are opinions, not advice. Please read our Disclaimers.

S&P China 500 Declined 2.8% in Q2 2019; Gains Stood at 20.2% YTD

Contributor Image
John Welling

Director, Global Equity Indices

S&P Dow Jones Indices

The S&P China 500 declined 2.8% in Q2 2019, as the U.S.-China trade tensions and threat of company sanctions weighed on returns, even as expectations for eased tensions improved. The decline followed the 23.6% Q1 2019 surge in the index, ultimately leading to overall healthy gains of 20.2% YTD.

Chinese stocks generally lagged global benchmarks in the quarter, as the majority of global country returns were positive. Chinese offshore stocks slightly outperformed onshore listings, as the S&P China BMI fell a lesser 3.3% compared with the S&P China A BMI’s 5.8% decline. As expected, the S&P China 500 posted average performance relative to most of the major Chinese equity benchmarks QTD and YTD, given its diversified composition across all Chinese share classes and sectors.

Most Sectors Declined in Q2 2019

Of the 11 sectors, 2 overcame the overall lower market performance for the quarter, as Consumer Staples (10.6%) and Financials (3.3%) gained, while Information Technology (-10.0%) fell the most, followed closely by Health Care (-9.7%). Positive YTD returns for each sector were a reflection of the outsized gains achieved by the majority of sectors in Q1 2019. YTD gains were led by the consumer sectors, as Consumer Staples (56.4%) gained the most—driven by the outsized 66.7% return of Kweichow Moutai—followed by Consumer Discretionary (27.6%).

 Financials—representing the largest sector of the index by weight—contributed most to the overall performance in Q2, adding 0.9% to the S&P China 500. The Financials sector gains were easily negated however, as the next three sectors by size—Consumer Discretionary, Communication Services, and Industrials each contributed -0.6%, -0.8%, and -0.8%, respectively, representing over 80% of index performance during the quarter.

Valuation Metrics Were Stable in Q2, in Line with Trailing Averages

The S&P China 500’s trailing price/earnings ratio (P/E) rose slightly in Q2, increasing to 14.4x as of June 28, 2019, from 14.0x in March 2019, nearing the 10-year average P/E of 14.7x, while representing a premium to the one-year moving average P/E of 13.1x. Meanwhile, the index’s forward P/E reflected lower prices over the quarter, falling somewhat to 12.2x as of the quarter’s end.

The S&P China 500’s valuations remained in range of broader emerging market indices, as the S&P Emerging BMI’s trailing and forward P/E ratios stood at 14.3x and 12.7x, respectively. The S&P China 500’s dividend yield, meanwhile, increased from 2.15% to 2.32% for the quarter.

The posts on this blog are opinions, not advice. Please read our Disclaimers.

The Opportunity Cost of Active Management

Contributor Image
Akash Jain

Director, Global Research & Design

S&P BSE Indices

Investors typically flock to active funds to pass on the stock-picking decision making to a seasoned fund manager, with the hope that the fund manager’s experience and stock-picking capabilities will enable the investor’s portfolio to grow at a faster pace than that set by the benchmark. By using this approach, investors are able to circumvent one problem, only to get stuck in another problem: which fund manager to choose?

As seen in the SPIVA® India Year-End 2018 Scorecard, a large proportion of active fund managers underperformed the benchmark. Over the 10-year period observed, 64% of the large-cap funds underperformed the benchmark, the S&P BSE 100.

In the Indian Equity Large-Cap and Indian Mid-/Small-Cap categories, there was a wide spread in fund performance across different investment horizons (see Exhibit 1). For example, the spread in returns for an investor in two different large-cap funds over a 10-year horizon ending Dec. 31, 2018, could have been as high as 13.2% CAGR. Therefore, the selection of a fund can play a critical role in portfolio returns. The performance range in the case of the Mid-/Small-Cap category was even higher, at 14.92% over a 10-year horizon. The story remains the same across different time horizons. Furthermore, the average net returns generated by active funds were not far off from the benchmark returns (see Exhibit 1).

 We also studied the distribution of fund returns and calculated their mean, standard deviation, and skew (see Exhibit 2). The study compared the fund returns data distribution with a hypothetical normal curve constructed with the same mean and standard deviation. Again, we considered the large-cap category and mid-/small-cap category for this analysis.

  • Large-Cap Category: We witnessed a positive skew (skewed to the right), which implies that, generally speaking, the mean was higher than median, indicating that few funds generated extraordinary returns, pulling the category average higher whereas the performance of most funds lies to the left of the mean.
  • Mid-/Small-Cap Category: We noticed a negative skew (skewed to the left). This implies that the mean was less than the median, which means that only a few funds with large underperformance were dragging the mean down, but that most funds generated superior funds in this category.

This analysis indicates that, at least in the large-cap category, the majority of the funds failed to beat the category average.

What is more challenging is that the relative peer performance of a mutual fund has not been consistent (see Exhibit 3), which means that funds that have outperformed in one period failed to maintain their superior performance in the following periods. In Exhibit 3, funds were classified into four quartiles based on their performance over the five-year period between Dec. 31, 2008, and Dec. 31, 2013. The columns to the right showcase how many of the funds continued to outperform their peers over the period from Dec. 31, 2013, to Dec. 31, 2018. Some important inferences include the following.

  1. In the case of the large-cap fund category, only 14.8% of the 27 top-quartile funds continued to be in the top quartile the following five years. However, in the mid-/small-cap category, 42.9% of the 14 top-quartile funds continued to be in the top quartile in the following five years.
  2. The worst-performing funds have higher probability to continue their underperformance. For example, in the mid-/small-cap category, 35.7% of the 14 funds in the bottom quartile continued their underperformance and failed to break out from the bottom quartile.
  3. The highest number of fund mergers/liquidations was witnessed in the bottom quartile. For example, in the large-cap category, 35.7% of the 28 funds (i.e., 10 funds) in the bottom quartile failed to survive the period from 2013 to 2018.

The writing on the wall is clear. Fund outperformance is random and predicting an outperforming mutual fund may be as challenging as the stock-selection process. From a purely mathematical point of view, an investor has better odds of flipping a coin than identifying an outperforming active mutual fund. Therefore, investing via a systematic, style consistent, low-cost passive route could be a better bet for an investor.

The posts on this blog are opinions, not advice. Please read our Disclaimers.

Carlos Urzúa Resignation and Low Volatility’s Response

Contributor Image
Maria Sanchez

Director, Sustainability Index Product Management, U.S. Equity Indices

S&P Dow Jones Indices

Mexico’s Finance Minister, Carlos Urzúa, abruptly resigned on July 9, 2019 over policy disagreements with the current government.[1] Market participants reacted negatively, generating volatility in the Mexican peso’s exchange rate, which fell 2.3% right after the announcement,[2] and the country’s equity market, and bringing a trial by fire for the S&P/BMV IPC Risk Weighted Index (MXN).

The S&P/BMV IPC Risk Weighted Indices aim to offer upside participation and downside protection, which was evident in their performance after the recent events in Mexico. While the total return of the flagship S&P/BMV IPC lost 1.77% in a single day, the low volatility strategy for Mexico, represented by the S&P/BMV IPC Risk Weighted Index (MXN), fell just 1%. The S&P/BMV IPC Risk Weighted Index (MXN)’s one-day outperformance of 77 bps showed a reversal in the indices’ month-to-date performance and reduced the difference in year-to-date returns (see Exhibit 1).

The bad news of this event is that market sentiment perceives instability in Mexico.

The good news is that this event proved the advantages a low volatility strategy can provide.

[1] NYTimes.com: Mexico’s Finance Minister Resigns, Rebuking the President’s Policies

[2] Mexico Peso Falls as Investors Fret Over Finance Minister’s Exit – Bloomberg

The posts on this blog are opinions, not advice. Please read our Disclaimers.

Palladium – All That Glitters Is Not Gold

Contributor Image
Fiona Boal

Managing Director, Global Head of Equities

S&P Dow Jones Indices

Much has been made during recent months of the renewed interest investors have shown in gold on the back of growing financial market turbulence, a plethora of geopolitical flashpoints, and a string of economic releases that have fallen short of expectations. But gold has not been the shiniest precious metal this year; back in January, palladium became the most expensive precious metal for the first time since 2002, and by July 8, 2019, it had reached USD 1,542 per troy ounce, a premium of almost USD 150 to gold. When compared to its sister metal, platinum, the performance of palladium has also been impressive, with the platinum/palladium ratio more than halving since the beginning of 2017.

Drivers of performance in the palladium market were a mix of broader, macro demand trends and commodity-specific supply constraints.

Approximately 80%  of palladium demand comes from the automotive industry. Its other uses include electronics, dentistry, and jewelry. As regulations on emissions have tightened, demand for palladium to be used in the catalytic converters of gasoline-powered vehicles has risen. Gasoline vehicles have also become more popular in the wake of a number well-publicized diesel emissions scandals (diesel-powered cars use platinum in their catalytic converters).

Palladium’s outperformance relative to platinum has rightly raised the question of substitution. While it may be theoretically possible for carmakers to switch from palladium to platinum, further technical advances and a reasonable lead time are likely required. It is also worth noting that even with a rally in price, the cost contribution of palladium in car manufacturing is low and may not warrant significant research and development resources, especially when the future of passenger travel may not revolve around the combustion engine.

Electric vehicles do not burn fuel and hence do not require catalytic converters; however, it is not clear how quickly the mass adoption of electric vehicle technology will occur and hence how long it will take for palladium’s largest end market to shrink and eventually disappear.

Palladium is a by-product of platinum and nickel mining and is primarily mined in South Africa and Russia, and both countries face a myriad of investment and production challenges. Palladium prices spiked in March 2019 when Russia’s Ministry of Industry and Trade announced it was considering a temporary ban on the export of precious metal scrap and tailings, while in South Africa, the world’s largest platinum miners are about to embark on a series of wage negotiations with unions, which in the past have led to lengthy mine strikes.

As a by-product, it is not just the prospects of the palladium price that are taken into consideration when a miner makes a short-term capital expenditure or longer-term investment decision.

One area where supply is expected to increase over the coming years is the secondary scrap market. As more and more end-of-life vehicles contain a significant amount of palladium in their auto catalysts, the level and sophistication of recycling will likely increase.

The S&P GSCI Palladium is up 32.8% YTD, making it one of the best-performing individual commodities during the first half of 2019. Its performance in the second half of the year and beyond will depend equally on the ongoing push for lower car emissions and the supply challenges of not being the primary product mined.

The posts on this blog are opinions, not advice. Please read our Disclaimers.