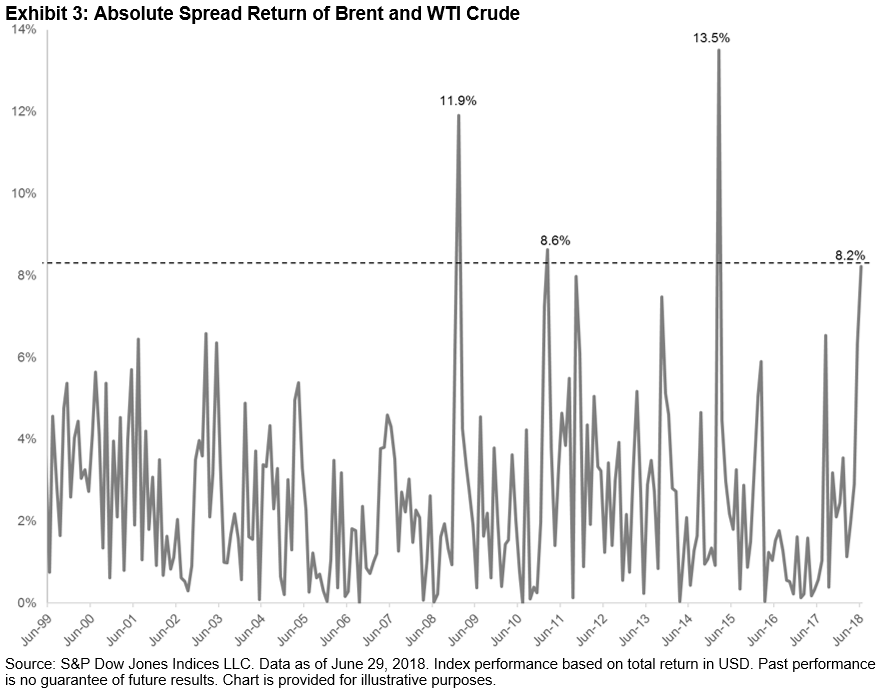
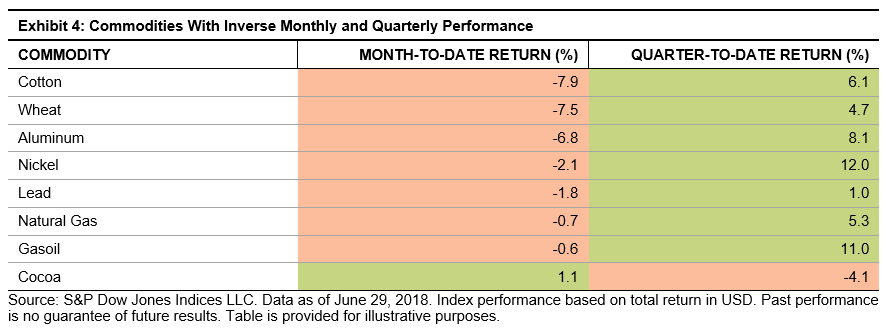
As of July 5, 2018, the S&P/LSTA U.S. Leveraged Loan 100 Index returned 2% YTD, compared with the S&P U.S. High Yield Corporate Bond Index’s return of -0.29%. In 2018, U.S. high-yield performance has experienced two rather sizeable negative returns—back-to-back declines in February (-1.05%) and March (-0.45%)—followed by a turnaround in April (see Exhibit 1). Steady positive performance throughout has kept loans in the green for the year. In 2017, U.S. high yield prevailed in overall performance versus loans (with 2017 total returns of 7.2% and 3.3%, respectively), as more return is expected for the risk of being almost five years out in duration (4.87% as of July 5, 2018—see Exhibit 2).
Increased demand for bank loans this year has caused more loans to come to market, providing record-setting supply and increasing the amount outstanding of the S&P/LSTA U.S. Leveraged Loan 100 Index by 5% since the beginning of the year. Such large amounts of supply kept the average price and monthly performance flat for May and June. Concerns about the recent supply have centered on loan quality and the number of deals with fewer covenants and other protections for investors.
The floating rate, senior secured characteristics of this asset class provide some downside protection when compared with an unsecured high-yield bond. Loans provide some relative protection against duration risk in rising rate environments and structural protections as a senior secured instrument in periods of economic stress.
The posts on this blog are opinions, not advice. Please read our Disclaimers.