Get Indexology® Blog updates via email.

In This List

Most S&P and Dow Jones Islamic Indices Outperform Conventional Benchmarks in 2017 Driven by Strength in the Technology Sector

Turning Point in Bond Yields

A More Thoughtful Approach to Broad Commodity Exposure

European Factor Highlights

A Growing ETF Market in India

Most S&P and Dow Jones Islamic Indices Outperform Conventional Benchmarks in 2017 Driven by Strength in the Technology Sector

Contributor Image
Michael Orzano

Head of Global Exchanges Product Management

S&P Dow Jones Indices

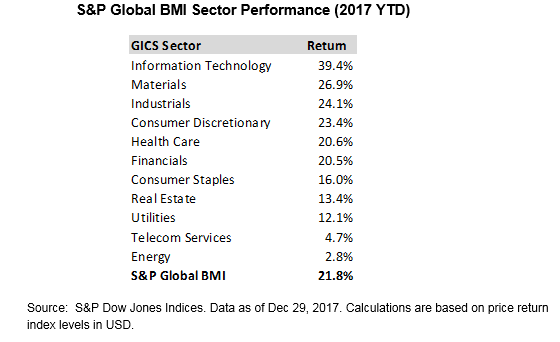
Most S&P and Dow Jones Shariah-compliant benchmarks outperformed their conventional counterparts for the year as information technology companies—which tend to be overweight in Islamic Indices—gained a whopping 39.4% beating the overall market by a wide margin, and financials—which are underrepresented in Islamic indices—experienced some weakness. This marked a reversal from 2016 where a surge in the financial sector late in the year caused Shariah-compliant benchmarks to lag. One notable exception to the 2017 trend was in the middle-east where conventional and Islamic benchmarks tracked closely together since technology stocks are not a meaningful portion of the regional market.

Despite Strong Absolute Returns, U.S. Equities Lag Global Markets for the First Time Since 2012

Global equity markets powered higher in the 4th quarter capping a very strong 2017. The S&P Global BMI Shariah and Dow Jones Islamic Market World each gained about 25% for the year, beating their conventional counterparts by more than 300 basis points. Emerging markets continued to lead the way as the DJIM Emerging Markets Index closed the year up more than 40% supported by huge gains in large-cap Chinese technology companies such as Tencent and Alibaba. Developed Asia-Pacific markets also experienced notably strong performance in 2017 as the DJIM Asia-Pacific Index finished the year up nearly 36%. Despite closing near a record high and gaining about 20% on the year, the S&P 500® lagged international markets for the first time since 2012.

MENA Equity Markets Continue to Lag

MENA equities continued to lag broader global equity markets as geopolitical concerns weighed on sentiment and the regional equity market has seen little benefit from the weak dollar and boom in technology stocks that has powered emerging markets more broadly. The S&P Pan Arab Composite Shariah edged slightly higher in the 4th quarter, finishing the year virtually unchanged. Despite a double-digit rebound in December, the S&P Qatar BMI experienced the steepest losses on the year, falling almost 17%. Meanwhile, the S&P Egypt BMI rose 21% in 2017 as the country has experienced stability following the implementation of the IMF-supported economic reform program in November 2016. 

The posts on this blog are opinions, not advice. Please read our Disclaimers.

Turning Point in Bond Yields

Contributor Image
David Blitzer

Former Managing Director and Chairman of the Index Committee

S&P Dow Jones Indices

The ten year Treasury note closed with a yield over 2.5% this week, sparking talk that interest rates may have bottomed. The first chart shows the yield on the 10 year treasury going all the way back to 1953.  As seen there, the bottom in July 2016 at 1.5%. Last March the yield was 2.5%, it then fell to 2% in September before rebounding.

The bigger picture is revealed in the chart. We have either recently passed or appear to be approaching a major bottom in the bond markets.  With a few dips during recessions, Treasury note yields climbed steadily from 1954 until 1981, turned and began what was once called The Great Intergalactic Bond Rally. Starting in September 1981yields fell for the next 35 years.  While picking the precise bottom is challenging, it is increasingly likely that the long term decline in bond yields is drawing to a close.

Among the factors arguing that we are at a turn in bond yields are the economy’s current strength and momentum and the Fed’s decision to shrink its balance sheet and move away from quantitative easing as they raise the Fed funds rate.  Real US GDP growth in the second and third quarters of 2017 topped 3%. Real business fixed investment grew at 6% in the first three quarters of 2017. The unemployment is down to 4.1%. The economy is growing faster than its long term potential growth, putting upward pressure on interest rates.

The monetary policy that brought interest rates close to zero and supported the recovery from the financial crisis is over. The Fed’s attention is now directed at establishing a safety margin with the Fed funds rate well above zero so that it can cut rates when the next recession arrives.

A short term result of the Fed’s continuing increase in the Fed funds rate is a flatter yield curve as seen in the chart of the spread between the 10-year and two-year treasury notes.  Some analysts argue that a flattening yield curve may be pointing to future economic softness and might persuade the Fed to stop raising the funds rate. However, the current increase in the yield on the ten year treasury is giving the Fed more room for raising the Fed funds rate going forward.

Two by-products of the economy’s strength also support the idea that we may be close to a bottom in bond yields. Inflation expectations (see next chart) are no longer falling. Market participants and the Fed will be watching expectations and the unemployment rate for hints of when inflation could pass 2%.  Rising oil prices, now over $60 per barrel, are another sign that inflation could creep upward and encourage investors to seek higher interest rates.

The posts on this blog are opinions, not advice. Please read our Disclaimers.

A More Thoughtful Approach to Broad Commodity Exposure

Contributor Image
Derek Babb

Senior Portfolio Manager

Elkhorn Capital Group, LLC

Over the last decade, beta commodity exposure has offered investors inefficient access to the commodity market, mostly due to front-month roll methodologies and fixed commodity weights. The Dow Jones RAFI Commodity Index is a broad commodity index based on Research Affiliates’ commodity strategy that utilizes price momentum and roll yield to provide (1) dynamic commodity weighting exposure and (2) intelligent futures contract selection.

The Dow Jones Commodity Index, as one of the oldest and most recognizable broad commodity indices, provides diversified broad commodity exposure to 24 commodities. Research Affiliates utilizes the Dow Jones Commodity Index as the starting point to build the Dow Jones RAFI Commodity Index, which is intelligently built to offer equal weight exposure to the energy, metals and agricultural sectors in order to maximize diversification.

The Dow Jones RAFI Commodity Index utilizes a dynamic roll process that considers both roll yield and contract liquidity in selecting which commodity contract to own. In addition, the strategy reevaluates contract selection on a monthly basis to ensure the optimal contract is owned.

Understanding How Roll Yield and Momentum Affect the Dow Jones RAFI Commodity Index

The Dow Jones RAFI Commodity Index utilizes two key factors in constructing its commodity strategy: High Roll Yield and High Momentum.

Roll Yield takes into consideration the shape of a commodity’s futures curve. The shape of the curve can serve as an important indicator of a commodity’s inventory levels. Low inventories can potentially create positive roll yield scenarios, where an investor can theoretically purchase a contract further out on the curve at a lower price than what they could purchase at a nearer-term contract. The strategy is designed to  increase its exposure to commodities with a positive roll yield. Conversely, high inventories can potentially create negative roll yield, where an investor purchases a contract further out on the curve at a higher price than what they could purchase at a nearer-term contract. The strategy is designed to decrease its exposure to commodities with a negative roll yield.

Momentum takes into consideration the price movement of commodities. Imbalances in supply or demand can create positive or negative price momentum which may persist over time. A decrease in supply created by a crop drought, for example, can drive prices higher. Conversely, a new discovery of oil can drive prices lower. The strategy is designed to increase its exposure to commodities with high price momentum.

Why Fundamental Commodities?

  • Strong hedge against Inflation
  • Broad, dynamic commodity exposure
  • Low cost, transparent institutional solution
  • Protection against negative roll yields

A Top Performing Broad Commodity Strategy

In 2017, The Dow Jones RAFI Commodity Index finished as the top performing* popular broad based commodity index. In addition, the Index provided superior return/risk statistics relative to both the Bloomberg Commodity Index and the S&P GSCI Index. While past performance is no guarantee of future results, the strategy of the Dow Jones RAFI Commodity Index has thus far proven to be one of the most intelligent strategic beta strategies in the broad commodity space.

*Source: Bloomberg L.P. as of 12/29/2017. All data based on total return figures.

The posts on this blog are opinions, not advice. Please read our Disclaimers.

European Factor Highlights

Contributor Image
Hamish Preston

Head of U.S. Equities

S&P Dow Jones Indices

We recently updated our S&P Europe 350 Factor Dashboard, which shows the factor exposures of a number of our European indices (interested parties can sign up here).  Here are some highlights from our year-end report.

Little separated the returns to European core factor indices, but all outperformed

While the extremely low stock-level dispersion contributed to a narrow range of core factor returns – only 8% separated the best from the worst – each of Enhanced Value, Momentum, Quality and Low Volatility outperformed the benchmark S&P Europe 350’s 10.75% total return in 2017.  This was the first calendar year since 2013 that every European core factor index beat the benchmark.  Higher exposures to smaller companies were beneficial to these indices as the S&P Europe 350 Equal Weight Index also beat the S&P Europe 350.  These benefits were in stark contrast to the U.S., where greater exposure to small size, as well as to value, proved a hindrance in 2017.

Exhibit 1: Performance of European Core Factors

Investors got what they paid for in European Dividend Strategies in Q4

Despite concerns earlier in the year that dividend strategies were becoming overvalued, the most expensive European dividend strategy at the end of the third quarter posted the highest return in the final three months of the year as the S&P Europe 350 Dividend Aristocrats rose 0.81%.  Although the S&P Europe 350 Quality was the worst performing index in our report since September, dividend strategies benefitted from greater exposure to higher quality stocks in the fourth quarter; total returns increased monotonically with quality scores.

The 11.04% annual gain in the S&P Euro High Yield Dividend Aristocrats showed the potential benefits of selecting high-yielding stocks with a track record of raising (or maintaining) dividends for at least a decade; the index topped the charts among European equity dividend strategies.


The posts on this blog are opinions, not advice. Please read our Disclaimers.

A Growing ETF Market in India

Contributor Image
Koel Ghosh

Former Head of South Asia

S&P Dow Jones Indices

A record-breaking collection on the Bharat 22 ETF (based on the S&P BSE Bharat 22 Index) earmarked a historical event for the Indian ETF market. The issue size pegged at to value INR 8,000 crores) received a nearly four-fold oversubscription, at over INR 31,000 crores.[1] This marked a huge success for the Indian government in its disinvestment program, and they decided to retain INR 14,500 crores and return the balance oversubscription.

The S&P BSE Bharat 22 Index is designed to measure the performance of 22 select companies disinvested by the central government of India. A well-balanced index, it cuts across six sectors, with a stock cap of 15% and a sector cap of 20%. The index was launched on Aug. 10, 2017, with a YTD return of 23.20% (as of Dec. 29, 2017).

Exhibit 1: S&P BSE Bharat 22 Index Returns 

INDEX NAME Returns (%)
3MTH            YTD
  Annualized Returns (%)
1 Year                  3 Year             5 Year              10 Year
S&P BSE Bharat 22 Index Total Return 8.44 23.20 23.20 9.85 13.69 8.98
S&P BSE Bharat 22 Index Price Return 8.30 20.26 20.26 7.40 11.07 6.70

Source: Asia Index Pvt. Ltd. Data as of Dec. 29, 2017. Past performance is no guarantee of future results. Table is provided for illustrative purposes.

The current exponential growth in the Indian ETF market is ushering in acceptance of the passive style of investing. However, it’s still in its nascent stages for this market compared with more developed markets such as the U.S. and Europe. As of Nov. 31, 2017, the global ETF market stood at over USD 4.7 trillion of assets under management, with 7,000 products across 70 exchanges. These statistics favor the U.S. and European markets, which constitute nearly 70% and 16% of the global ETF markets, respectively. The top three global ETF issuers are iShares, Vanguard, and State Street.

In India, the current statistics estimate assets of USD 8 billion, with 67 products[2] and a YTD growth of over 100%; assets were at USD 3 billion at the end of 2016. The growth can be mainly contributed to the inflows in the Bharat 22 ETF and the CPSE ETF, both of which are government initiatives. The growth in assets in the Nifty and SENSEX ETFs are also a result of the boost provided by the introduction of investments in ETFs by pension funds. We see that in India, the government is providing a major impetus to the growth of the ETF space, thereby promoting passive investment.

As always, the active and passive debate is an ongoing one. Since its launch in 2013, the SPIVA® India Scorecard has aimed to provide some statistical evidence to support the argument. The latest scorecard showcased that in the large-cap equity funds category, over 50% of active large-cap equity funds in India underperformed the S&P BSE 100 in the 1-, 5-, and 10-year periods ending June 2017. Over the three- and five-year periods ending June 2017, the majority of actively managed mid-/small-cap equity funds in India outperformed the S&P BSE MidCap. However, over the one-year period, 56.52% of those funds lagged the benchmark (for details, see the SPIVA India Mid-Year 2017 Scorecard).

Exhibit 2: Percentage of Funds Outperformed by the Index
FUND CATEGORY COMPARISON INDEX ONE-YEAR (%) THREE-YEAR (%) FIVE-YEAR (%) TEN-YEAR (%)
Indian Equity Large-Cap S&P BSE 100 52.87 34.19 50.93 58.47
Indian ELSS S&P BSE 200 38.10 16.22 19.44 41.38
Indian Equity Mid-/Small-Cap S&P BSE MidCap 56.52 43.94 37.31 50.00
Indian Government Bond S&P BSE India Government Bond Index 37.21 64.81 75.47 93.33
Indian Composite Bond S&P BSE India Bond Index 73.83 93.65 96.91 90.70

Source: S&P Dow Jones Indices LLC, Morningstar, and Association of Mutual Funds in India. Data as of June 30, 2017. Past performance is no guarantee of future results. Table is provided for illustrative purposes.

Access to market beta and indexed returns is slowly gaining momentum. The benefits of index-based investing—low costs, diversification, flexibility, and access to a theme, sector, segment, or strategy via one vehicle—are making their way into the Indian market and its participants.

The hope is that as the space widens, its opens up more ideas and concepts to index-based investing. While we are still a while away from artificial intelligence ETFs, surely more advanced strategic indices such as factor indices can be adopted by market participants to explore the passive style!

[1]   Source: Times of India, Nov. 21, 2017.

[2]   As of Nov. 31, 2017.

The posts on this blog are opinions, not advice. Please read our Disclaimers.