Get Indexology® Blog updates via email.

In This List

Does Factor Investing Deserve More Attention in Hong Kong?

Green Bond Market: October 2017

Are Quality Stocks Expensive in China?

Income Is Expensive but Don’t Wait for a Free Lunch

Can SDGs Shape the Future of Corporate Disclosure?

Does Factor Investing Deserve More Attention in Hong Kong?

Contributor Image
Priscilla Luk

Managing Director, Global Research & Design, APAC

S&P Dow Jones Indices

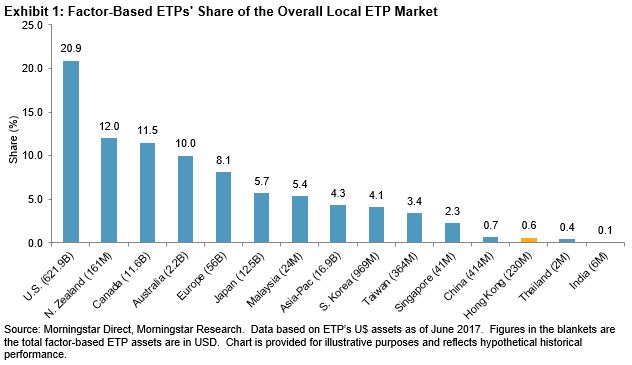
Factor investing, which is also broadly referred to as smart beta, has gained popularity in the global asset management industry, especially in the exchange-traded funds segment.  Factor-based index-linked products are used as cost-effective tools to enhance return or reduce risk by increasing number of market participants in the U.S., with 20.9% of U.S. ETP assets represented by factor-based products as of June 2017.  In the Asia Pacific region, factor-based ETPs only accounted for 4.3% of regional ETP assets.  The adoption of factor-based products by market participants in the Hong Kong market has been far behind other Asian markets such as Australia and Japan.

Since the launch of the Hong Kong-Mainland Stock Connect programs, there has been a growing market demand for factor-based index-linked products for Hong Kong equities.  Due to the tight control on the Qualified Domestic Institutional Investor (QDII) quota, stock connect programs have become favorable channels for mainland Chinese asset managers to gain offshore diversification.  Exploiting the benefit of factor-based investing may help them to deliver better returns in their offshore portfolios.

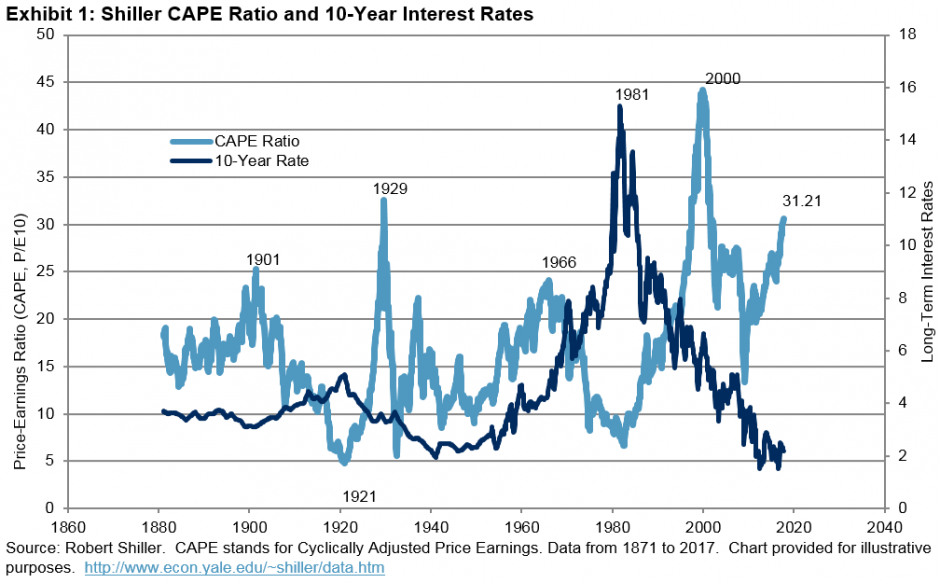
The Hong Kong equity market reflects the local economy as well as mainland China’s economy, while Hong Kong’s exchange rate is pegged to the U.S. dollar and Hong Kong interest rates primarily follow the U.S. interest rate cycles.  This poses challenges to portfolio management for Hong Kong equities, especially when the Chinese and U.S. economic growth and inflation diverge.  It is doubtful whether the factor-based strategies, which are commonly used by market participants in foreign markets to enhance portfolio performance, behaved in similar ways as seen in other markets.

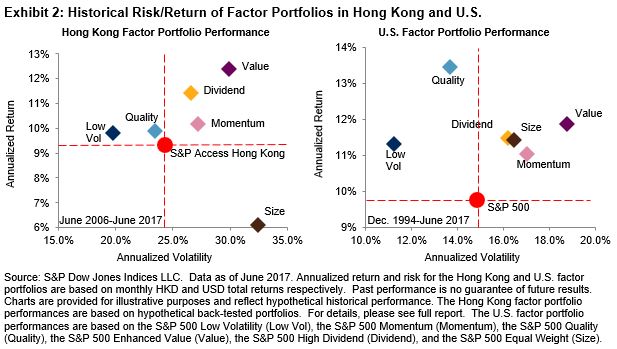
In our recently published research “How Smart Beta Strategies Work in the Hong Kong Market”, we examined the effectiveness of six well-known risk factors— size, value, low volatility, momentum, quality, and dividend— in the Hong Kong equity market and we observed, apart from small caps, that all of these factors delivered return alpha over the long term on an absolute and risk-adjusted basis, historically.[1]  The hypothetical portfolios for value and dividend delivered the highest excess returns, while those for low volatility and quality showed reduced volatility compared to the underlying benchmark.  The historical risk/return profile of the factor portfolios in Hong Kong broadly aligned with those in the U.S., apart from the small-cap factor.

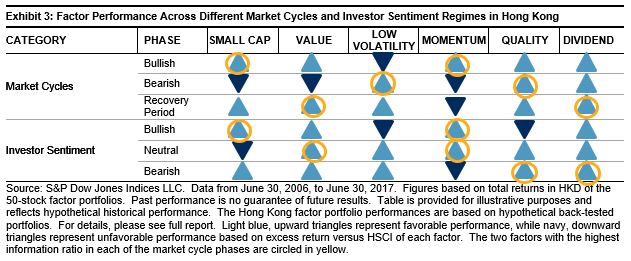
Our macro regime analysis on the Hong Kong equity factor portfolios suggested that these portfolios are sensitive to the local equity market cycles and investor sentiment regimes.  The low volatility and quality portfolios tended to be most defensive in response to the market cycles and their performances were the least vulnerable to bearish investor sentiment.  In contrast, small-cap and momentum stocks were most cyclical across market cycles and they were most rewarded when investor sentiment was bullish on the equity market (see Exhibit 3). Because of the distinct cyclicality in factor performance, factor portfolios could also be potential tools for market participants to implement their active views on the Hong Kong equity market.

[1]   Based on the 50-stock hypothetical factor portfolios selected from the S&P Access Hong Kong Index universe, please see full report for details.  The S&P Access Hong Kong Index is designed to reflect the universe of Hong Kong-listed stocks available to Chinese mainland market participants through the Southbound Trading Segments of the Shanghai-Hong Kong Stock Connect and Shenzhen-Hong Kong Stock Connect Programs.

The posts on this blog are opinions, not advice. Please read our Disclaimers.

Green Bond Market: October 2017

Contributor Image
Dennis Badlyans

Former Associate Director, Global Research & Design

S&P Dow Jones Indices

In October 2017, nearly USD 10 billion of green bonds were issued, bringing the total to USD 94 billion YTD (see Exhibit 1).  The pace was slower than the record USD 15 billion of issuance seen in September 2017; however, if history repeats itself, November 2017 may give us another record month.  Germany led the pack in October, accounting for 32% (USD 3 billion) of the issuance, followed by China with 22.5% (USD 2.1 billion).

Issuance of green bonds in China has primarily come from commercial banks amid the government’s increased focus on and prioritization of the environmental concerns.  Despite being a latecomer to the green bond market, China is the third-largest issuer, following supranational entities and U.S.-domiciled entities.  After the debut issuance by the Agricultural Bank of China in October of 2015, the country accounts for 14.1% of the green bond market.  After the drastic measures recently taken by the government in shuttering factories, project-based issuance may become a vital lifeline to many companies in affected regions.

The majority of the new issuance in October qualified for the S&P Green Bond Index, which is designed to track the global green market.  Of those bonds, 70% qualified for the S&P Green Bond Select Index, which further limits exposure subject to stringent financial and extra-financial eligibility criteria (see Exhibit 3).  As of Nov. 1, 2017, the global green market had USD 242.4 billion of outstanding debt, USD 220.0 billion of which is included in the S&P Green Bond Index, with USD 172.0 billion in the S&P Green Bond Select Index.

The posts on this blog are opinions, not advice. Please read our Disclaimers.

Are Quality Stocks Expensive in China?

Contributor Image
Liyu Zeng

Director, Global Research & Design

S&P Dow Jones Indices

Quality investing has been one of the most widely accepted investment philosophies.  The attractiveness of quality stocks stems from their defensive nature under distressed market conditions.  In China’s A-Share market, quality stocks have gained renewed attraction in 2017.  In the first nine months of 2017, the quality portfolio outperformed the other factor portfolios in absolute terms (see Exhibit 1).

The S&P Access China A-Share Dividend Opportunities was launched on Sept. 11, 2008.[1]  All other portfolios are hypothetical portfolios based on the same starting universe.[2]  The top 100 stocks with the highest factor scores in the eligible universe are selected, subject to a 20% rebalance buffer by number of stocks, following the corresponding standard S&P DJI methodologies.[3]
Source: S&P Dow Jones Indices LLC.  Data from Dec. 31, 2016, to Sept. 29, 2017.  Index performance based on total return in RMB.  Past performance is no guarantee of future results.  Chart is provided for illustrative purposes and reflects hypothetical historical performance.

As the prices of quality stocks rise, the risk of paying too much for good quality stocks may become a concern for market participants.  As of Sept. 29, 2017, compared to the respective eligible universe, the S&P China A-Share Quality Portfolio exhibited strong tilts toward quality features (high profit margin, low financial leverage, and low accrual ratio) and defensive features (low beta and low volatility) as expected.  However, it also exhibited unintended tilts toward more expensive valuations (higher price-to-book and high price-to-sales ratios).

The S&P China A-Share Quality Portfolio is a hypothetical portfolio.
Source: S&P Dow Jones Indices LLC and Factset.  Data as of Sept. 29, 2017.  Chart is provided for illustrative purposes and reflects hypothetical historical performance.  Characteristic tilts are calculated as the weighted Welch’s T-test relative to the eligible universe disclosed in footnote 3.  Positive/negative tilt to a certain parameter denotes that the S&P China A-Share Quality Portfolio had higher/lower value in that parameter than of the eligible universe.[4]

Exhibit 3 further extended the analysis on the historical valuation of the S&P China A-Share Quality Portfolio.  As we can see, quality stocks have been relatively expensive not just recently, but consistently in the history.  From June 2006 to September 2017, the S&P China A-Share Quality Portfolio tended to have relatively higher price-to-fundamental ratios, especially price-to-book, price-to-sales, and price-to-cash flow ratios, than its corresponding eligible universe.

To avoid buying into overvalued high-quality stocks, a natural approach would be to apply a secondary value screen on the quality portfolio to exclude relatively expensive quality stocks.

Based on what we have observed in other markets,[5] value portfolios and quality portfolios tend to have low correlation in performance and tend to exhibit distinct cyclicality.  We found that in China’s A-share market, that the rolling 250-day correlation between the excess returns of the quality portfolio and value portfolio over the 10-year period were fairly low, most of the time in negative domain, which suggests the potential diversification benefits for combining these two factors in portfolio construction (see Exhibit 4).

The S&P China A-Share Quality Portfolio is a hypothetical portfolio.
Source: S&P Dow Jones Indices LLC and Factset.  Data as of the end of June and December each year from 2006 and 2017, as well as Sept. 29, 2017.  Charts are provided for illustrative purposes and reflects hypothetical historical performance.

S&P China A-Share Quality Portfolio and S&P China A-Share Enhanced Value Portfolio are hypothetical portfolios.
Source: S&P Dow Jones Indices LLC.  Correlation was calculated based on the daily excess returns in RMB relative to the S&P China A BMI from June 30, 2007, to Sept. 29, 2017.  Past performance is no guarantee of future results.  Chart is provided for illustrative purposes and reflects hypothetical historical performance.

[1]   For detailed index methodology, please see https://asia.spindices.com/indices/strategy/sp-china-a-share-dividend-opportunities-index-chinese-renminbi .

[2]   Constituents were drawn from the combined universe of the S&P China A BMI and the S&P China A Venture Enterprise Index.  Eligible stocks must have a float-adjusted market cap no less than RMB 1 billion and three-month average daily value traded no less than RMB 20 million.  For factor portfolios except for small cap, a 10% buffer was applied on the size and liquidity thresholds that favor existing constituents.

[3]   Size is measured by a float-adjusted market cap.  Value is measured as the average z score of earnings-to-price, sales-to-price, and book value-to-price ratios.  Volatility is measured as the one-year realized price return volatility.  Momentum is measured by the z score of six-month risk-adjusted momentum, calculated as the price return over the past six months (excluding the most recent month) divided by the standard deviation of daily price returns during the same period.  Quality is measured as the average z score of balance sheet accrual ratio (BSA ratio), financial leverage and ROE.  Constituents of value, momentum, and quality portfolios are weighted by score-tilted market cap, subject to security and sector constraints such that the weight of each security is between 0.05% and the lower of 5% and 20 times its float-adjusted market-cap weight in the starting universe, and the maximum weight of any given GICS sector is 40%.  The small-cap and low-volatility portfolios are weighted by a float-adjusted market cap and inverse of volatility, respectively, without any security or sector constraints.  The low-volatility portfolios are rebalanced quarterly effective on the third Friday in March, June, September, and December.  The rest of the factor portfolios were rebalanced semiannually, effective on the third Friday in June and December.

[4]   Positive tilt to market capitalization denotes the tested portfolio had a large-cap bias compared to the benchmark.  Positive tilt to beta or volatility denotes the tested portfolio was less defensive.  Positive tilt to the price-to-fundamental ratio means the tested portfolio was more expensive than the benchmark.  Positive tilt to LT debt to capital and BSA ratio means companies in the tested portfolio had higher financial leverage and poorer earning quality, respectively.  Positive tilt to net margin or ROE means companies in the tested portfolio were more profitable.

[5]   Ung, Daniel and Luk, Priscilla (2016).  “What Is in Your Smart Beta Portfolio? A Fundamental and Macroeconomic Analysis.”  S&P Dow Jones Indices. Zeng, Liyu and Luk, Priscilla (2017).  “How Smart Beta Strategies Work in the Hong Kong Market”  S&P Dow Jones Indices.

The posts on this blog are opinions, not advice. Please read our Disclaimers.

Income Is Expensive but Don’t Wait for a Free Lunch

Contributor Image
Philip Murphy

Former Managing Director, Global Head of Index Governance

S&P Dow Jones Indices

Those looking to convert risky assets into predictable income streams by purchasing bonds or annuities may be disappointed to learn how relatively little income they can acquire with a given level of wealth.  However, it is more constructive to accept capital market conditions for what they are rather than looking at this as an insurmountable problem.  While low rates equate to expensive income, the other side of the same coin is rich valuation of the stock market (driven by a number of factors but perhaps mainly due to low rates).  It is historically rare to have the free lunch of buying relatively cheap income with relatively high-valued stocks.  From around 1949 to 1966, capital markets did offer that precise bargain.  Stock valuations, as measured by Robert Shiller’s CAPE ratio, increased from between 9-10 in 1949 to a peak of over 24 in early 1966 (see Exhibit 1).  The 10-year Treasury rates moved from about 2.30% to about 4.75% over the same period.  Those who retired around  1965 who planned ahead and began buying income a little at a time, say 15 years before retirement, would have converted increasingly valued equites into increasingly cheaper (and therefore larger) predictable cash flows.

Unfortunately, free lunches are a rare treat.  Most of the time, stock valuations have been high when interest rates were low, and vice versa.  For example, in the early 1980s when rates hit all-time highs, the CAPE ratio sank well below 10.  You could have bought a lot of income with a given wealth level, but if your wealth was in stocks it was not a great time to sell.

Looking ahead, higher rates may coincide with lower stock valuations.  For those approaching retirement, timing income acquisition may be just as fraught as timing stocks.  On the other hand, buying expensive income with expensive equities may not be as poor a tradeoff as it first seems—particularly if implemented a little at a time through a methodical program.  Dollar cost averaging is a time-tested approach to wealth accumulation; why not apply the same technique to other long-term financial challenges like providing retirement income?

S&P Dow Jones Indices has an index series that represents a strategy of doing just that—dollar cost averaging into assets that mitigate the risk of future inflation-adjusted income.  It is called the S&P STRIDE Index Series, but the strategy it measures is not the only way to accomplish the same goal.  Bond laddering is another, and there are insurance-based solutions like annuities and guaranteed minimum withdrawal programs.  For 401(k) savers, laddering is not feasible and insurance products are not widely available.  However, many retirement plan sponsors are actively looking for solutions to facilitate an income goal as the ultimate mission of their plans.  If you are fortunate enough to have a retirement plan, that is half the battle.  If you have a plan but do not have income options, speak to your benefits department to encourage them to begin considering how to offer a retirement income program within the plan.

The posts on this blog are opinions, not advice. Please read our Disclaimers.

Can SDGs Shape the Future of Corporate Disclosure?

Contributor Image
Libby Bernick

Global Head of Corporate Business

Trucost, part of S&P Dow Jones Indices

Businesses are showing increasing interest in using the Sustainable Development Goals (SDGs) to inform and enhance their social and environmental programs and ultimately their business strategies.  The SDGs were adopted by the United Nations in 2015 and include 17 ambitious goals and 169 targets aimed at ending poverty, protecting the planet, and ensuring prosperity for all.

The appeal of the SDGs for companies and financial institutions is that they harmonize the social, environmental, and economic aspects of sustainable development and—perhaps most importantly—provide a clear vision of what the international community wants to achieve.  They give meaning and purpose, not just to corporate sustainability programs, but to an organization’s business objectives.

There are also pragmatic business reasons for pursuing the SDGs.  Achieving the goals could create over USD 12 trillion per year in business value in clean and efficient energy, affordable housing and access to healthcare, and material efficiency and waste management.

But there are challenges with the SDGs.  Although three-quarters of companies under the UN Global Compact say they are taking action to meet the SDGs, this is often for a single goal—usually ones pertaining to creating good jobs, economic growth, health, and well-being.  Moreover, some of these companies only choose to report against goals that correspond to existing environmental or social targets.

A few multi-stakeholder organizations have developed SDG reporting frameworks to help companies and financial institutions, including the Cambridge Institute for Sustainable Leadership, the Dutch SDG Investing Agenda, the GRI and UN Global Compact, Earth Security Group with HSBC, and the Sustainable Development Investment framework.  Although they are a great first step, some are too generic and lacking in precise metrics, while others are more detailed but struggle to address global goals or the need to create business value.

Building on almost 20 years of experience working with companies and financial institutions on measuring ESG performance and integrating it into business and investment decisions, Trucost considers that a successful SDG framework should be based on the following best practice principles.

  • Total value creation: incorporate financial, social, and environmental value creation to assess materiality and quantify impacts.
  • Material: focus on SDGs that are financially relevant and where the business has potential to make the most significant positive or negative impact.
  • Quantifiable outcomes: include specific metrics that can be measured so that companies and investors can quantify impacts and track performance over time.
  • Measurable against targets: focus on contributing toward specific SDGs, taking into account geographic differences.
  • Market context: relatable to current responsible investment and ESG reporting frameworks already in use in different sectors.
  • Value chain: consider the full range of positive and negative activities across a corporate value chain from supplies of raw materials to manufacturing operations and the use and disposal of products and services.
  • Comparable: allow investors and other stakeholders to compare performance within and across industry sectors as well as assets classes.

Trucost believes that an SDG framework based on these principles would strike the right balance between being applicable to a wide range of sectors, yet adaptable to sector-specific issues; holistic to incorporate social, environmental, and economic aspects of sustainable development, yet focused to capture the most significant impacts for a business; idealistic to inspire business leaders and employees, yet pragmatic to make good business sense.

Trucost will set out its thinking on SDGs in more detail in a forthcoming discussion paper entitled Moving Forward with SDGs: Metrics for Action.  Go to www.trucost.com for more information.

The posts on this blog are opinions, not advice. Please read our Disclaimers.