Various events during the second half of 2016, both global—such as the U.S. Federal Reserve rate hike and the U.S. elections—and domestic—such as passage of the GST bill in Parliament and demonetization—kept Indian markets volatile. Over the one-year period ending December 2016, Indian equity markets underperformed Indian bond markets. The S&P BSE 100, which seeks to measure the large-cap equity market in India, ended in the black, at 5.02%. The mid-cap equity market, as measured by the S&P BSE MidCap, returned 9.28% over the same period. The S&P BSE India Government Bond Index delivered a total return of 13.51%.
The S&P Indices Versus Active (SPIVA) India Scorecard, which is a biannual report, attempts to capture the performance of active funds (both equity and debt funds) domiciled in India against S&P BSE benchmarks over different time horizons. The study reveals that over the one-year period ending December 2016, 66.29% of Indian Equity Large-Cap funds, 64.29% of Indian ELSS funds, and 71.11% of Indian Equity Mid-/Small-Cap funds underperformed their respective benchmark indices. Additionally, the majority of the Indian Composite Bond funds underperformed the S&P BSE India Bond Index over 1-, 3-, 5-, and 10-year periods, whereas the majority of Indian Government Bond funds underperformed the S&P BSE India Government Bond Index over 3-, 5-, and 10-year periods (see Exhibit 1).
Exhibit 1: Funds that Underperformed the Benchmark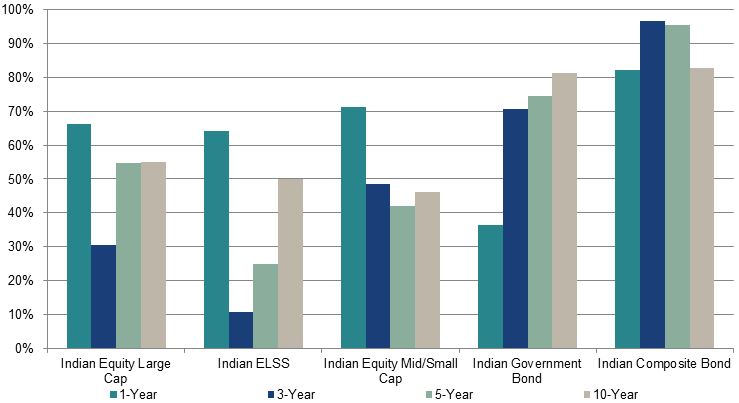
Source: S&P Dow Jones Indices LLC, Morningstar, and Association of Mutual Funds in India. Data from December 2006 to December 2016, based on the SPIVA India Year-End 2016 Scorecard. Past performance is no guarantee of future results. Chart is provided for illustrative purposes and reflects hypothetical historical performance.
Over the five-year period ending December 2016, apart from Indian ELSS funds, none of the categories (across equity and debt) had a 100% survivorship rate. Over the 10-year period, Indian Equity Large-Cap funds showed a survivorship rate of 66.7%, whereas Indian Equity Mid-/Small-Cap funds had a 65.1% survivorship rate. Over the same period, the Indian Government Bond and Indian Composite Bond funds had even lower survivorship rates, at 51.7% and 58.7%, respectively.
Over the 10-year period, style consistency was fairly low for Indian Equity Large-Cap funds (30.6%) and Indian Equity Mid-/Small-Cap funds (28.6%). This is particularly important because a market participant may want to understand not only whether a fund has survived the investment horizon but also the percentage of funds that stayed consistent to their initial investment categorization. Globally, style classification is an important metric that can guide market participants in their asset allocation decisions. On the other hand, Indian ELSS funds have largely been style consistent. Not only have a large number of these funds managed to outperform the benchmark, but they have done so with a higher margin over the three- and five-year horizons than any other category, at 3.9% and 2.5%, respectively.
As Indian markets have matured, we have observed convergence to global mature markets in terms of outperformance of benchmark indices and fees.
To discover more about the performance of Indian active funds versus their benchmarks, check out the SPIVA India Year-End 2016 Scorecard.
Exhibit 2: Asset-Weighted Outperformance of Funds Versus Respective Benchmarks 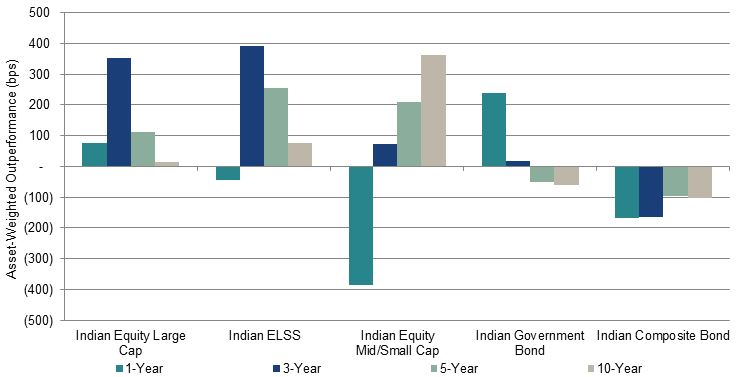
Source: S&P Dow Jones Indices LLC, Morningstar, and Association of Mutual Funds in India. Data from December 2006 to December 2016, based on the SPIVA India Year-End 2016 Scorecard. Past performance is no guarantee of future results. Chart is provided for illustrative purposes and reflects hypothetical historical performance.
Exhibit 3: Equal-Weighted Outperformance of Funds Versus Respective Benchmarks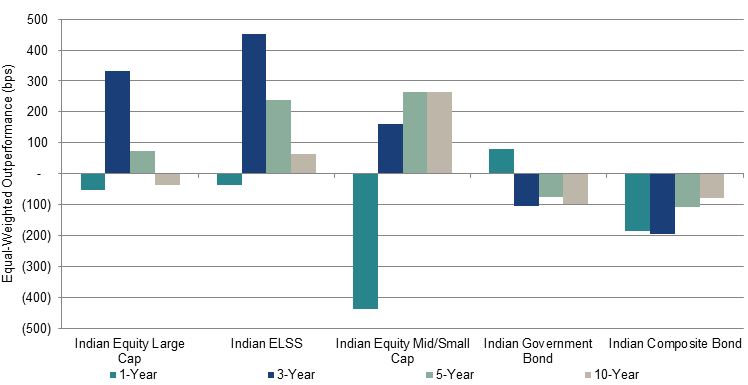
Source: S&P Dow Jones Indices LLC, Morningstar, and Association of Mutual Funds in India. Outperformance measured in INR. Data from December 2006 to December 2016, based on SPIVA India Year-End 2016 Scorecard. Data from December 2006 to December 2016, based on the SPIVA India Year-End 2016 Scorecard. Past performance is no guarantee of future results. Chart is provided for illustrative purposes and reflects hypothetical historical performance.
The posts on this blog are opinions, not advice. Please read our Disclaimers.