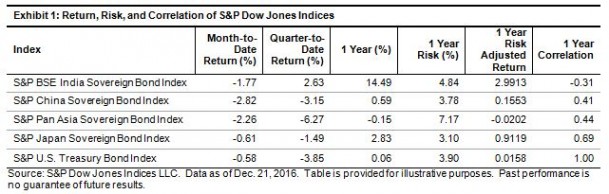
A look back may be a telling way to view municipal bonds in 2017. The modest total return of the S&P Municipal Bond Index (0.77%) in 2016 masked an atypical year of volatility for the normally staid market place. During the year, municipal bonds enjoyed being one of the ‘risk off’ asset classes and as low and negative yields permeated the global bond markets municipal bonds became a source for incremental yield over other options. Countering all the positives was the worst performing month for municipal bonds since 2008 as November (the index was down over 4.8%) reflected the tax uncertainty the future holds for tax-exempt bonds post the U.S. presidential election.
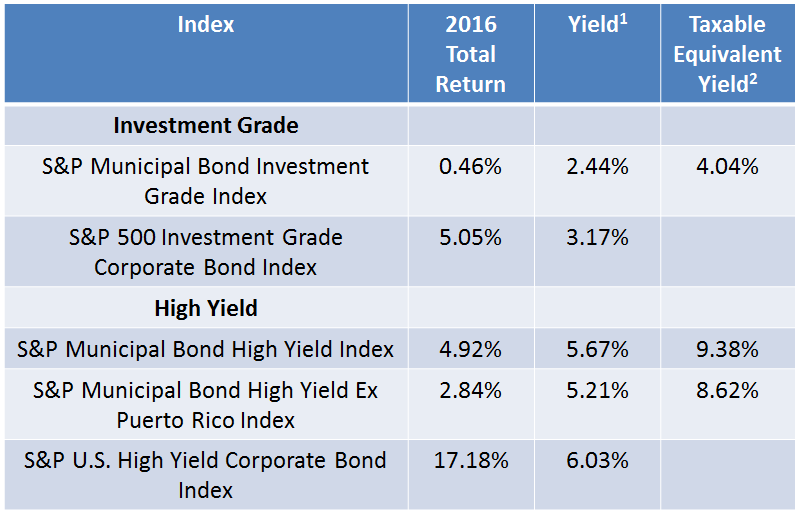
Table 1: Select bond indices, their yields and returns as of December 30, 2016:
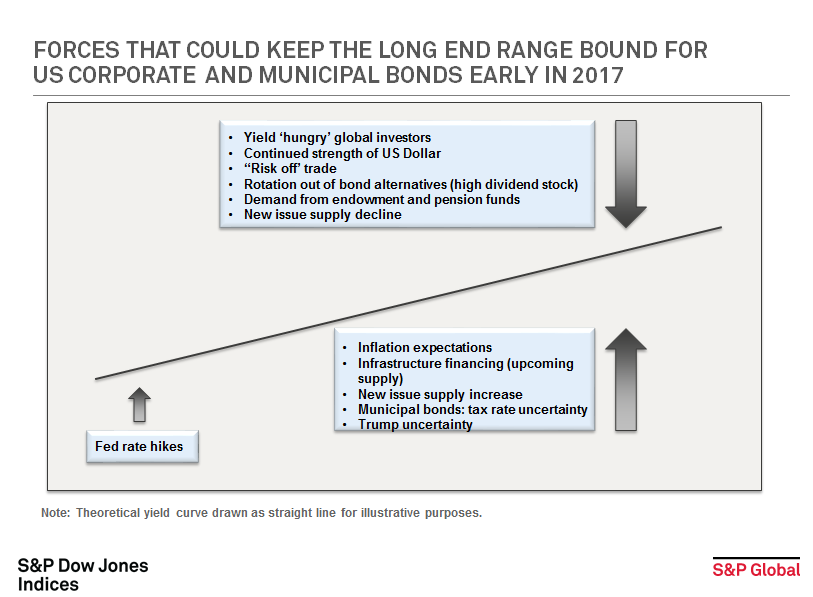
How does this impact 2017?
- The devastation of municipal bond prices following the U.S. presidential election has created opportunities as the yields of non-callable, investment grade, tax-exempt municipal bonds have risen to a point where they cannot be ignored. Two examples are:
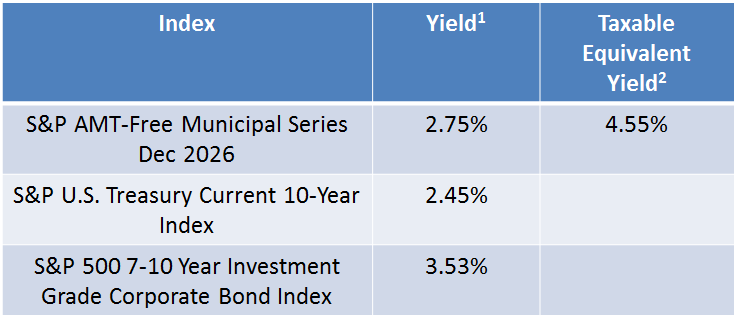
- The five year range tracked in the S&P AMT-Free Municipal Series Dec 2022 and the ten year range tracked in the S&P AMT-Free Municipal Series Dec 2026 had year-ending yields higher than their U.S. Treasury bond equivalents and when viewed from the perspective of Taxable Equivalent Yield the yields of municipal bonds ended incrementally higher in yield than similar U.S. corporate bonds.
- Factors impacting municipal bonds in 2017 could include:
- Clarity on potential tax law changes. Potential tax rate cuts along with other changes could impact the value of tax-exempt municipal bonds negatively.
- New issue supply.
- Inflation expectations.
- Sourcing of funding for U.S. infrastructure improvements. Infrastructure has typically been funded via the municipal bond markets. Alternative bond like financing could have an impact on supply.
- Continued and elevated global uncertainty driving ‘risk off’ investing behavior. (Russia, Syria, China et al)
- Continued and sustained global low and negative yield environments fueling the drive for yield.
- Retail investor sentiment as measured by fund inflows and outflows continues to play an important role in the direction of bond prices and hence returns in the municipal bond market.
A deeper dive into 2016 performance:
- The S&P Municipal Bond Investment Grade Index ended in positive territory but underperformed relative to its corporate bond peer substantially due to the tax uncertainty illustrated in November 2016. The result is that yields have risen to become attractive verses taxable bonds.
- The S&P Municipal Bond High Yield Index was impacted by the rebound in Puerto Rico but also underperformed verses corporate bonds. This complex and less liquid market has historically demanded a ‘yield premium’ which currently is illustrated in both its nominal yield and Taxable Equivalent Yield.
- The S&P Municipal Bond Puerto Rico Index saw a rebound of over 11% in 2016 as the future of the revenue bonds became a bit clearer. However, there is much more work to be done in Puerto Rico.
- Long duration ‘tobacco settlement bonds tracked in the S&P Municipal Bond Tobacco Index also saw another year of positive returns. Down over 6.7% for the last three months of the year, the index still reflected a positive 4.79% in total return for 2016. Advance refundings of higher cost debt also contributed to these returns and a slower pace of advance refundings may be seen in 2017 particularly if rates continue to rise. An important negative is the long duration nature of these bonds.
- Long duration high grade municipal bonds tracked in the S&P Municipal Bond 20 Year High Grade Index ended the year down over 2% after suffering through a tough last quarter down over 9%. Another long duration segment that could suffer more as rates rise.
- The high debt per capita of the Virgin Islands has finally caught up with the ‘Puerto Rico syndrome’ as this small sliver of the municipal bond market was down over 13%. A 2017 recovery while not impossible would be surprising.
Table 2: Select bond indices tracking the five year maturity range, their yields and returns as of December 30, 2016:
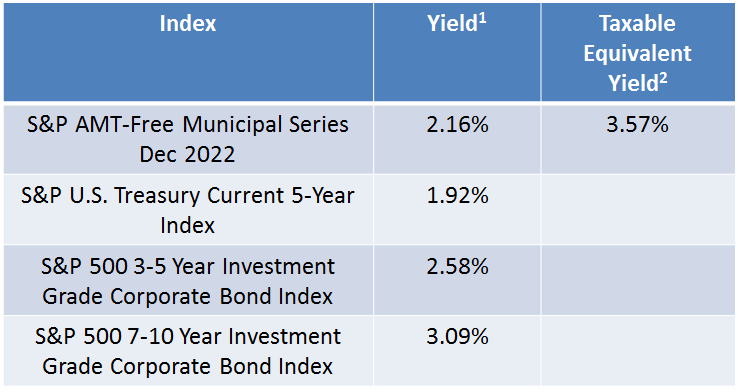
Table 3: Select bond indices tracking the ten year maturity range, their yields and returns as of December 30, 2016:
The posts on this blog are opinions, not advice. Please read our Disclaimers.