Get Indexology® Blog updates via email.

In This List

15% of Global GDP is in Negative Yielding Bonds

Rieger Report: Muni Market's own "Lunar" Calendar

Rieger Report: Energy Sector Helps Drive Market

Asian Fixed Income: Indonesian Bonds Rally

Janet Yellen’s Message: Last Friday’s Employment Report Didn’t Change Much

15% of Global GDP is in Negative Yielding Bonds

Contributor Image
Jason Giordano

Director, Fixed Income, Product Management

S&P Dow Jones Indices

As of June 10, 2016, there is USD 10.6 trillion in negative yielding assets throughout the world—that’s more than 15% of global GDP. The increase in assets with sub-zero yields is evident when looking at the S&P Global Developed Sovereign Bond Index. On a market value basis, sovereign bonds with negative yields now account for 51% of the index (up from 27% at year-end 2015).

negative yieltding bonds

There are a number of global factors that contribute to negative bond yields, however it’s worth clarifying that there is a difference between negative yields and negative rates. Central banks set policy rates to control economic growth, and economies require low levels of inflation to grow.  Central banks attempt to ensure adequate inflation while protecting against high inflationary conditions and avoiding deflationary conditions.  As such, the Bank of Japan first cut its benchmark interest rate below zero to -0.1% in January 2016.  The rate cut was an attempt to counteract the effect of falling oil prices and to help achieve its target inflation goal of 2%.  In November, central banks in Europe imposed negative rates on commercial banks in an effort to encourage banks to lend and prompt businesses and savers to spend and invest.  Furthermore, Sweden’s policy rate is currently -0.5%, and Switzerland cut its rate to -0.75%.

Capture1

Capture

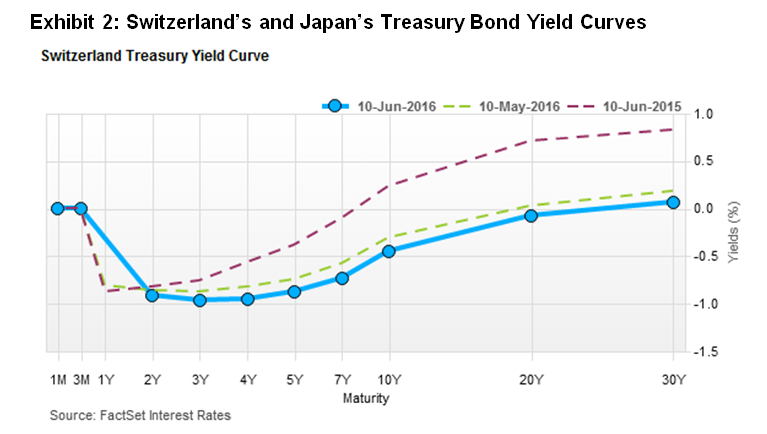
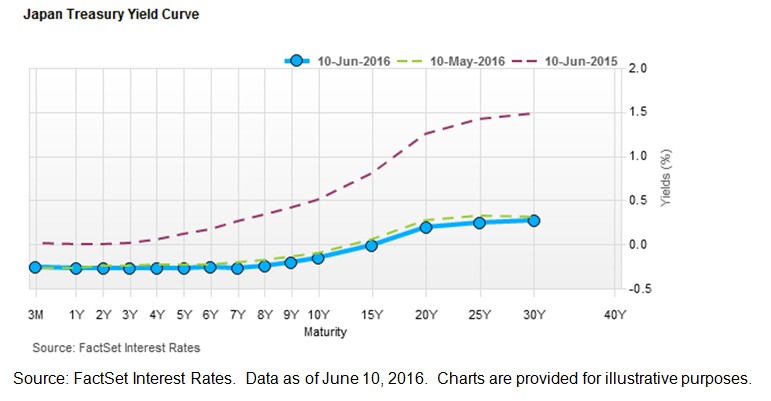
Alternatively, many yields on sovereign debt have turned negative due to a concern over a lack of economic growth. Yields have turned negative in Belgium, Denmark, Finland, France, Germany, Ireland, Italy, Sweden, and Switzerland.  Since the financial crisis, sub-zero yields have occurred sporadically, however they have typically appeared during times of market stress and predominantly in short-dated, highly liquid assets.  It seems that this is no longer the case, as negative yields have now spread to intermediate maturities throughout European and Japanese sovereign bonds.  The current yield on a 20-year Swiss government bond is -0.08%.

The negative yield environment is reflective of a principal preservation mentality, in which market participants are more concerned with “return of capital” than “return on capital.” However, it’s worth noting that current yields assume that bonds will be held to maturity; some market participants may believe they will be able to sell the bonds for more than they paid (i.e., yields will fall even more).


The posts on this blog are opinions, not advice. Please read our Disclaimers.

Rieger Report: Muni Market's own "Lunar" Calendar

Contributor Image
J.R. Rieger

Former Head of Fixed Income Indices

S&P Dow Jones Indices

The municipal bond market is a huge and diverse segment of the bond markets.  Part of the ‘lore’ of the muni bond market has been that the summer months of the year create a natural increase in demand for municipal bonds.  It turns out there is a basis behind this ‘lore’.

Using the broadest municipal bond index at S&P (and I believe in the muni market place), the S&P Municipal Bond Index and examining the concentration of debt maturing in each month gives us a  visual of a ‘lunar’ like affect on the municipal bond market.

Some statistics describing the characteristics of the S&P Municipal Bond Index (as of June 10, 2016):

  • Tracks over 91,000 bond issues
  • Represents over $1.72 trillion in market value and $1.62 in par value
  • Average coupon is 4.52% (par weighted)
  • Average monthly interest implied is $6.2 billion (based on par value * coupon/12)  but that is simply an average that does not take into account the ‘lunar’ cycle for municipals.

The ‘Lunar’ municipal cycle:  By par value,  41.7% of the par value of debt matures in the months of June, July and August.  Meaning their semi-annual coupons are paid in December, January, February, June, July and August. This creates a wave of coupon cash flow coupled with a concentration of  bonds maturing in June, July and August that helps foster reinvestment demand for municipal bonds in the summer months.

Table 1: Monthly maturity distribution of bonds in the S&P Municipal Bond Index:

Source: S&P Dow Jones Indices, LLC. Data as of June 10, 2016. Table is provided for illustrative purposes. It is not possible to invest directly in an index. Past performance is no guarantee of future results.

A key to understanding the impact of such a cycle is determining how much of that coupon and maturing bond cash flow is reinvested in the municipal bond market and how much is used to generate an income stream for it’s bondholders.

Another perspective is how much debt is retiring or maturing each year in the next few years.  Other bond markets, like the high yield corporate and senior loan markets often have high concentrations of debt maturing in specific years in the near future – often referred to as a ‘maturity cliff’.

Table 2: Maturity distribution by par value of the S&P Municipal Bond Index:

Source: S&P Dow Jones Indices, LLC. Data as of June 10, 2016. Table is provided for illustrative purposes. It is not possible to invest directly in an index. Past performance is no guarantee of future results.


The posts on this blog are opinions, not advice. Please read our Disclaimers.

Rieger Report: Energy Sector Helps Drive Market

Contributor Image
J.R. Rieger

Former Head of Fixed Income Indices

S&P Dow Jones Indices

The recent oil price rally has pushed the energy sector upward in both the equity and bond markets. In the second quarter so far, the S&P 500 Energy Index (equity) has returned over 9.1% in total return and the S&P 500 Energy Corporate Bond Index has returned over 7.3%.  Meanwhile, the broader indices have seen more modest returns: the S&P 500 Bond Index (the debt of the S&P 500 companies) has returned 2.61% and the S&P 500 (TR) has returned 2.21%.

Table 1: Select indices and their quarter-to-date returns:

Source: S&P Dow Jones Indices, LLC. Data as of June 10, 2016. Table is provided for illustrative purposes. It is not possible to invest directly in an index. Past performance is no guarantee of future results.

Yields of bonds in the S&P 500 Energy Corporate Bond Index have tumbled as bond prices have rallied.  At the end of March the average yield of bonds in the index was a 5.17%  and ended June 10th at a 3.95% –  a 122 basis point drop.  The average yields of bonds in the S&P 500 Bond Index have also fallen but only by 25 basis points during this time frame, helped in part by the inclusion of the energy bond sector.

Chart 1: Select indices and their yields (Yield to Worst):

Source: S&P Dow Jones Indices, LLC. Data as of June 10, 2016. Chart is provided for illustrative purposes. It is not possible to invest directly in an index. Past performance is no guarantee of future results.

The posts on this blog are opinions, not advice. Please read our Disclaimers.

Asian Fixed Income: Indonesian Bonds Rally

Contributor Image
Michele Leung

Former Director, Fixed Income Indices

S&P Dow Jones Indices

Despite hawkish FOMC minutes and a stronger U.S. dollar, Indonesian bonds rallied 10.15% year-to-date (YTD), outperforming the other nine countries tracked by the S&P Pan Asia Bond Index, data as of Jun 7, 2016.

The S&P Indonesia Bond Index tracks the performance of local currency denominated government and corporate bonds from Indonesia and with a total market value of IDR 1,511 trillion. The robust gain was boosted by the strong performance of sovereign bonds; the S&P Indonesia Sovereign Bond Index rose 10.78% in the same period. The index’s yield-to-maturity tightened 115 bps YTD to 7.73% , after reaching a 13-month low at 7.40% in mid-April 2016.

The S&P Indonesia Corporate Bond Index gained 7.36% YTD, while its yield-to-maturity tightened 125 bps to 9.07%. Across sector-level indices, the S&P Indonesia Utilities Bond Index outperformed the other sector indices and advanced 8.32%.

Standard & Poor’s Ratings Services recently revised its outlook on the long-term sovereign credit ratings on the Republic of Indonesia to ‘positive’ from ‘stable,’ while affirming the ‘BB+’ long-term and ‘B’ short-term sovereign credit ratings. The market expects more investors to access the Indonesian market if the speculation of rating upgrade becomes materialized, particularly for those who have not been holding Indonesia bonds for rating reasons.

Exhibit 1: The Yield-to-Maturity of the S&P Indonesia Corporate Bond Index and the S&P Indonesia Sovereign Bond Index

20160607


The posts on this blog are opinions, not advice. Please read our Disclaimers.

Janet Yellen’s Message: Last Friday’s Employment Report Didn’t Change Much

Contributor Image
David Blitzer

Former Managing Director and Chairman of the Index Committee

S&P Dow Jones Indices

Last Friday the markets were expecting to see May payrolls rise by something between 160,000 and 190,000 new jobs. Instead the report was an upsetting shocker with only 38,000 new jobs and a downward revision to the previous two months.  Stocks sold off at the opening, gold rose, talk of a fading expansion resumed and everyone agreed that there wouldn’t be a Fed rate hike this month.  Until Friday morning Fed watchers were expecting a last minute confirmation of a June rate hike from Janet Yellen in today’s speech.  After the bad news employment report analysts feared the weakness would limit the Fed’s ability to move rates higher until later in the year.

Speaking in Philadelphia today, Fed Chair Janet Yellen was clear that one nasty employment report doesn’t change the world or the economic outlook: “So the overall labor market situation has been quite positive. In that context this past Friday’s labor market report was disappointing.”  The Fed is making progress in meeting its mandate of 2% inflation and full employment:

  • Inflation is expected to move to 2% over the next couple of years. The sharp drop in oil prices and the strengthening of the dollar which were holding inflation down are reversing and these downward forces on prices are dissipating.
  • Friday’s report notwithstanding, the job market has improved throughout seven years of expansion. The unemployment rate has fallen, the job openings rate was a record high in March and the quit rate moved up. Weekly initial unemployment claims continue at very low levels.

Yellen’s economic outlook remains cautiously optimistic, even though there are a few clouds on the horizon but further progress is expected.

  • Further improvements in the labor markets and moderate GDP growth are foreseen. Rising equity and home prices have helped restore households’ wealth and the housing sector should see further gains. Housing is supported by low mortgage rates and consumer spending is helped by low gasoline prices.
  • “On the other hand” there are some less positive issues: China’s slowing growth, falling commodity prices and weak business fixed investment in the U.S.

There are four important uncertainties that could affect the economy and monetary policy:

  • The US expansion has been largely supported by domestic demand. The question is whether US moderate growth can continue without support from other economies, especially with the weak domestic investment performance.
  • Risks outside the US require attention as well. China’s growth is a concern although their currency has moved in a more predictable fashion recently. In the current environment of low interest rates and weak growth investors’ perception of risks can change quickly.  One unknown risk factor is the possibility that Britain will vote to leave the European Union.
  • US productivity has performed poorly in recent quarters and has not shown any signs of returning to stronger growth so far. This contributes to sluggish GDP growth and poor wage increases.
  • The inflation outlook is uncertain and dependent on expectations of future inflation. While oil prices are likely to recover and the labor market is improving, there are signs that expectations of future inflation are falling somewhat.

In the face of these uncertainties, Janet Yellen remains cautiously optimistic, describes monetary policy as stimulative with the Fed funds rate below its neutral level. Given all this, Yellen expects “further gradual increases in the federal funds rate will probably be appropriate to best promote the FOMC’s goals of maximum employment and price stability.”

The posts on this blog are opinions, not advice. Please read our Disclaimers.