Get Indexology® Blog updates via email.

In This List

Election Year 2016: Will A Republican President Help Oil?

Asian Fixed Income: Southeast Asian Bond Markets

Seven Commodities To Love

Mexico Fixed Income Markets: Foreign Investors Repositioning in Linkers

February Brings Both the Positive and the Negative in European Government Bond Markets

Election Year 2016: Will A Republican President Help Oil?

Contributor Image
Jodie Gunzberg

Former Managing Director, Head of U.S. Equities

S&P Dow Jones Indices

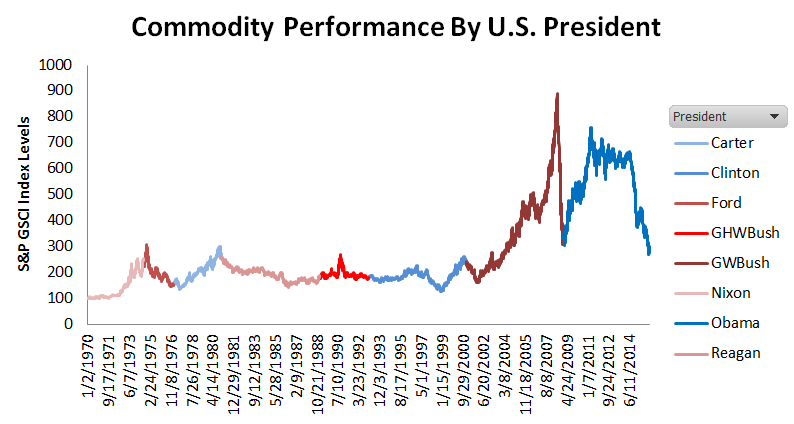
In honor of President’s Day, Election Year 2016 will be a new series of posts about how U.S. presidents and parties have impacted commodities through history. The index history goes back to Jan 2. 1970 when President Richard Nixon was in office. During the time period, there have been eight presidents, including three Democrats and five Republicans.

On average, the annualized returns of commodities during Democratic presidencies was 5.4%, almost 6 times better than under Republican presidencies that added just 0.9%. The S&P GSCI performed best under Republican President Nixon, gaining 21.9% annualized, but it also performed the worst under a Republican President, losing 16.6% annualized under President Ford.

Source: S&P Dow Jones Indices.
Source: S&P Dow Jones Indices. Reds represent Republican Presidents and blues represent Democratic Presidents.

Many have a perception that U.S. Republican Presidents are good for oil given President George W. Bush’s oil business success. Overall, oil performed well during President George W. Bush’s time in office with an annualized return of 4.5%. From his start in 2001 until oil’s peak in July 2008, the commodity returned 388% or 23% annualized.  However, he couldn’t stop the 71% drop that plagued his last six months of office.

It seemed hopeful with a party switch that the next president might help oil recover. Shortly after the inauguration, on Jan. 20, 2009, of the U.S. Democratic President Obama, oil bottomed then gained 179%, that is 56.3% annualized through April 2011. Unfortunately, he wasn’t able to stop an oil drop either, as it has fallen 72%, slightly more than it did in its drawdown under the prior president.

As it turns out, (WTI) crude oil was only added into the index in 1987, so there have been just five presidents to examine, but oil has only been negative under President Obama. Oil performed best under President Clinton with an annualized return of 6.2%, followed by Presidents George W. Bush (4.5%,) Reagan (1.2%,) George H.W. Bush (0.4%) and Obama (-3.4.)

Source: S&P Dow Jones Indices. Reds represent Republican Presidents and blues represent Democratic Presidents.

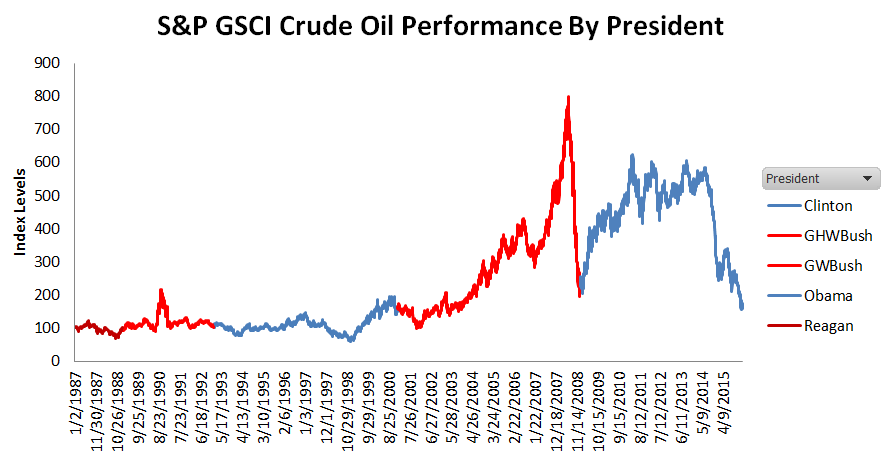
On average, oil under the Republican Presidents returned 2.1% versus 1.4% under the Democratic Presidents. The Democratic Presidents represented both the best and the worst oil performance with oil performance during Republican Presidencies falling in the middle.

More important than the next elected party, the U.S. government may only have a meaningful impact for oil based on how (if) it regulates oil supply.  Beyond the supply, the strength of the U.S. dollar may be the strongest domestic force on oil prices. There may need to be global coordination between OPEC and non-OPEC suppliers to cut production, and some demand strength from emerging markets, including China, in order for oil to turn around.


The posts on this blog are opinions, not advice. Please read our Disclaimers.

Asian Fixed Income: Southeast Asian Bond Markets

Contributor Image
Michele Leung

Former Director, Fixed Income Indices

S&P Dow Jones Indices

2015 was a difficult year for emerging markets, as investors reduced their exposure to emerging markets and some shifted to developed markets. With concerns about a growth slowdown, a strong U.S. dollar, and the plunge in oil prices continuing to linger, some investors have remained cautious about allocating their exposure to emerging markets.
Looking specifically at the Southeast Asian local debt markets, there is evidence that they have shown resilience when compared with the equity markets; for example, the S&P BSE 500 (TR) climbed 0.45% in 2015, while the S&P BSE India Bond Index rose 8.40% in the same period.
As tracked by the S&P Pan Asia Bond Index, the bond markets in Malaysia, Singapore, Indonesia, India, and Thailand all delivered positive returns last year. In fact, these countries have demonstrated robust growth trends since the index was incepted on Dec. 29, 2006 (see Exhibit 1).

Exhibit 1: Total Return Performance of the Southeast Asian Sovereign Bond Indices20160215

Looking at index performance YTD, the S&P Indonesia Bond Index had a strong start and gained 4.54%, outperforming other Southeast Asian bond indices, which increased by 0.5%-1.5%. As presented in Exhibit 2, the yield-to-maturity of most countries has come down a bit in the past two years, which is in line with the global bond markets.  As of Feb. 10, 2016, the yield-to-maturity of the S&P Malaysia Sovereign Bond Index stood at 3.49%, and its sovereign debt is rated as ‘A-‘ and ‘A3’ by Standard & Poor’s Ratings Services and Moody’s, respectively.

Exhibit 2: Current Yield-to-Maturity of the Southeast Asian Sovereign Bond Indices20160215b

The posts on this blog are opinions, not advice. Please read our Disclaimers.

Seven Commodities To Love

Contributor Image
Jodie Gunzberg

Former Managing Director, Head of U.S. Equities

S&P Dow Jones Indices

It’s no secret commodities have been struggling in 2016 adding pressure to their greatest catastrophe in history. While much of this is from energy, with a year-to-date loss of 24%, the S&P GSCI Non-Energy is only down 1.4% for the year. Further, the precious metals sector in the index is up 17.4% year-to-date. Now that is something to love, and they aren’t the only commodities posting gains this year. Seven commodities are positive year-to-date including gold +17.7%, silver +14.4%, lean hogs +6.6%, zinc +5.9%, lead +2.0%, soybeans +1.1% and corn +0.4%. In honor of Valentine’s Day, below is a poem I wrote to give them the love they deserve.

VDay Comms

I hope you enjoyed something fun and light with this gift from me to you. Happy Valentine’s Day!

The posts on this blog are opinions, not advice. Please read our Disclaimers.

Mexico Fixed Income Markets: Foreign Investors Repositioning in Linkers

Contributor Image
Dennis Badlyans

Former Associate Director, Global Research & Design

S&P Dow Jones Indices

  • In January, foreign investors rotated positions back into UDIBonos, adding about 1.2% market share—a significant allocation to this investor base.
  • Flows into government bonds as a whole remain muted—in net, foreign investors withdrew about MXN 9 billion over the same period. (CETES: decreased MXN 32 billion; MBonos: increased MXN 7 billion).
  • January inflation surprised analysts at 0.38% vs. expectation of 0.28% according to the Banamex survey released on Feb. 5, 2016. Additionally, the survey shows that analysts expectation for full year 2016 inflation to be at 3.07%.
  • UDIBonos performance has lagged: current breakeven-inflation levels are below analysts’ expectations for inflation.

Throughout most of 2015, inflation in Mexico surprised analysts with its downside, finishing the year at a historical low of 2.13% (year-over-year).  By mid-year 2015, foreign investors began to pare back exposure to inflation-linked UDIBonos, which they had been allocating aggressively to over the 12-month period prior.  While foreigners are not the dominant price setters for UDIBonos, the reduction in position, which amounted to about 3% (May-December 2015) of market share, or MXN 37 billion (using the average UDI/MXN), weighed on performance of the inflation-linked instruments.

Capture

It is worth noting that although net foreign flows into government bonds have been muted, investors rotated out of both nominal and real rates, adding to bills (Chart pack available on request) and keeping exposure to Mexican pesos.

Over the year, average UDIBonos yields, as measured by the , were up 110 bps, eroding coupon and inflation carry on the bonds, leading to a 1.8% loss in terms of total return in pesos.  This is compared to yields on MBonos (nominal bonds), as measured by the S&P/Valmer Mexico Sovereign Bond Index, which moved up only 32 bps, with the index returning 4.3%, buoyed by its coupon carry.


Capture

As of January 26, 2016, foreign investors added MXN 15.7 billion (UDI 2.9 billion) YTD to UDIBonos and MXN 7 billion YTD to MBonos, while they reduced CETES positions by MXN 32 billion.  Although the addition to UDIBonos doesn’t seem outsized in cash terms, we note that foreigners own about 60% of the MBonos market, versus 11% of the UDIBonos market.  This highlights the important increase in relative terms to allocations in the inflation-linked bonds.  Both MBonos and UDIBonos have benefited, as yields have declined by as much as 50 bps on UDIBonos and 30 bps on MBonos.

Capture

The relative performance leaves break-even points only marginally wider and below the 3% handle.  January 2016 inflation in Mexico surprised analysts at 0.38%, versus the expectation of 0.28% (Banamex survey), with base effects driving the year-over-year figure to 2.61% from 2.13% in December 2016.  Although seasonality of inflation (February-March) warrants caution, year-end inflation is expected to rise to 3.1% (Banamex survey), while break-even points calculated using the June-2022 bond from the S&P/Valmer Mexico Sovereign Bond Index versus June-2022 bond from the S&P/Valmer Mexico Government Inflation-Linked UDIBONOS Index are pricing 2.7%, or 37 bps, below current year-end inflation expectations.

Capture

The posts on this blog are opinions, not advice. Please read our Disclaimers.

February Brings Both the Positive and the Negative in European Government Bond Markets

Contributor Image
Heather Mcardle

Director, Fixed Income Indices

S&P Dow Jones Indices

Germany and Luxembourg government bond yields have tightened nearly 30 bps since the beginning of 2016, moving the S&P Germany Sovereign Bond Index and the S&P Luxembourg Sovereign Bond Index yields back into negative territory (see Exhibit 1).  Yields on both indices last hit negative territory in April 2015, at the height of the Greek debt crisis.  Swiss government bonds have been consistently negative since January 2015, and the S&P Switzerland Sovereign Bond Index is has tightened 22 bps since the beginning of 2016.

Capture

Due to the inverse relationship between yields and prices, while yields are negative the performance of these indices is positive.  As of Feb. 8, 2016, performance of the S&P Switzerland Sovereign Bond Index was one of the highest in the eurozone, at 3.4% YTD; the S&P Germany Sovereign Bond Index came in at 3.04% YTD, and the S&P Luxembourg Sovereign Bond Index returned 1.70% YTD (see Exhibit 2).

Capture

Fears over the financial health of some of the larger European banks and the volatility in the stock market are causing risk aversion and are leading some investors into the relative safety of European government bonds.  This, coupled with indications that the ECB might increase its QE program in March, could be setting the stage for continued negative yields with positive performance in this “safe” asset class.

The posts on this blog are opinions, not advice. Please read our Disclaimers.