Get Indexology® Blog updates via email.

In This List

The Rieger Report: Municipal Bonds Hold On but Puerto Rico Sinks to New Depths

A Time of Disruption and Change for Canadian Financial Advisors

Will the Rise of Chinese Equity Markets Impact Fund Flows into the Indian Equity Markets?

Greek Fatigue

What’s Behind Biotech Gains?

The Rieger Report: Municipal Bonds Hold On but Puerto Rico Sinks to New Depths

Contributor Image
J.R. Rieger

Former Head of Fixed Income Indices

S&P Dow Jones Indices

Data as of June 26, 2015:

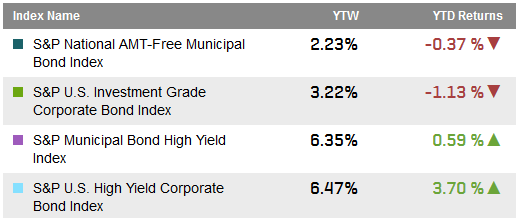
The investment grade municipal bond market has managed to hold steady with a modest negative return of -0.37% through June 26th 2015.  Investment grade corporate bonds have returned -1.13% during the same period.

High yield municipal bonds have been pulled downward by Puerto Rico but have still managed to eek out a positive return of 0.59%.   Meanwhile, junk corporate bonds have returned 3.7% year-to-date.

Select Fixed Income Index Yields and returns:

Source: S&P Dow Jones Indices LLC.  Data as of June 26, 2015.
Source: S&P Dow Jones Indices LLC. Data as of June 26, 2015.

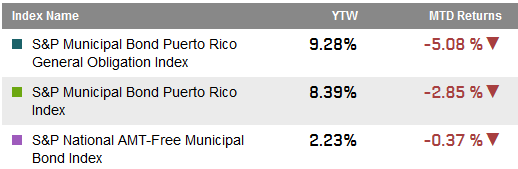
This past weekend Puerto Rico’s governor has stated the public debt is un-payable.  Last week, the G.O. debt had plumbed new depths helping to record a negative 5% month-to-date return for the S&P Municipal Bond Puerto Rico General Obligation Index. The facts are the situation isn’t looking good: the pending PREPA July 1st default looms on the market, the possible restructuring of the Government Development Bank debt and the possible postponement of G.O. set – asides have sent alarms to G.O. bond holders.

Select Municipal Bond Indices: (Month-to-Date)

Source: S&P Dow Jones Indices LLC.  Data as of June 26, 2015.
Source: S&P Dow Jones Indices LLC. Data as of June 26, 2015.

After years of turmoil, the events in Puerto Rico are beginning to come to a boil.  The impact of defaults on the rest of the bond market, if any, remains to be seen.


The posts on this blog are opinions, not advice. Please read our Disclaimers.

A Time of Disruption and Change for Canadian Financial Advisors

Contributor Image
Shaun Wurzbach

Managing Director, Head of Commercial Group (North America)

S&P Dow Jones Indices

On June 24, 2015 S&P Dow Jones Indices hosted an ETF Masterclass in Canada: ETFs as a Catalyst for Canadian Advisory Growth.  In advance, we believed that what would be top-of-mind for advisors was the use of ETFs for global diversification.  Our panels were also prepared to address proactively positioning their firm for regulatory change, such as the Client Relationship Model.  In reality, what was really top-of-mind for our attendees were advisor fees and robo-advice.

Fees came up as a response to Beth Hamilton-Keen’s comments during her presentation on “Putting Clients First…”  She voiced an opinion that Canadian mutual fund management expense ratios (MER) seem high compared with other countries and that  part of those fees are received as compensation by Canadian advisors and banks using those mutual funds.   During Q&A, some advisors vocally interpreted Beth’s comments to mean that they should cut their fees.  One advisor spoke of his right to defend his fees as long as he was delivering value to the client.

Clare O’Hara of the Globe and Mail asked her panel to share thoughts about robo-advice.  Panelist Mark Yamada, President and CEO of PŮR Investing offered remarks that are not completely reprintable here.   Certainly Mark believes robo-advice will disrupt some financial advisors.  Specifically, he said robo-advice will reduce the value of financial advisors that solely offer investment advice, similar to a robo-portfolio.  Instead, he expressed that advisors could either charge a lower fee for investment advice only or focus on more valuable areas of practice, such as planning or tax advice.  In Q&A, a few questions came up about the ability of robo-advisors to match the quality and timeliness of the advice services an advisor may provide to keep clients on track, particularly in down-markets.

What of ETFs?  Advisors I spoke with after our event were universal in their praise of comments made by panelist Raymond Kerzérho, Director of Research at PWL Capital.  Raymond described humbly and in clear and concise language how PWL Capital adopted ETFs.  He stated that PWL Capital uses all ETFs for their high net worth (HNW) clients, and the company has now grown in that practice to manage more than USD1 billion in HNW client assets with ETFs as their investment tool of choice.

Several advisors attending our event mentioned that there is still not enough high quality, simple-to-understand educational materials available on ETFs for their clients, or enough practical education for advisors to use.  In order to make this information easily accessible, we have published several new papers on index themes in Canada which can be found on spdji.com.

The posts on this blog are opinions, not advice. Please read our Disclaimers.

Will the Rise of Chinese Equity Markets Impact Fund Flows into the Indian Equity Markets?

Contributor Image
Alka Banerjee

Former Managing Director, Product Management

S&P Dow Jones Indices

The rise of passive investing in recent times has had a large influence on global fund flows. Country weights in the global benchmarks are increasingly determining the amount of funds that flow into various stock markets. The US with its 50% share in the global benchmarks has dominated the global investing scene for a very long time. However a market which has emerged from the shadows very rapidly in recent times has been China. Till recently largely accessed via its listings in Hong Kong and the US the mainland market labelled the ‘A’ share market has remained outside the purview of global investors. Starting in 2003 capital controls have been slowly loosened via its QFII and then its RQFII program and investors have been able to access the mainland A share market via pre-approved quotas. In November 2014 the Hong Kong Shanghai Connect program was launched which provided access to the Shanghai stock exchange listings through separate quotas and large daily limits not bound by the QFII and RQFII limits. Not surprisingly this far easier access has propelled the Chinese markets to grow more than 76% this year alone far outpacing India’s flat stock market performance.

As of now India has an approximately 10 % weight in the S&P Emerging BMI (Broad Market Index),while China which is represented only by Hong Kong, other overseas listings like the US and the mainland B share market accounts for a 31% weight. These numbers are similar across other competitor global benchmarks. Given the large push the Chinese government is making to open up mainland China shares to the global investing population another potential USD 3.8 trillion of investable market capitalization could be accessible for inclusion in the global benchmarks. If and when that happens, China’s weight in the emerging benchmarks will shoot up to 60% and pushing India’s weight down to 6% based on current numbers.

Currently only one third of the Indian market is available to global investors due to fairly stringent foreign investment restrictions. While China has similar restrictions but the sheer size of the market will add another $3.8 trillion to the investable pool with the opening up of the Chinese mainland market. Add this to the painful bureaucracy that most global investors have to face while investing in India, could well reduce the strong fund flows India has witnessed in recent times.

The posts on this blog are opinions, not advice. Please read our Disclaimers.

Greek Fatigue

Contributor Image
Craig Lazzara

Former Managing Director, Index Investment Strategy

S&P Dow Jones Indices

Greece’s financial problems have dominated headlines in the past week.  Here, e.g., are some excerpts from The Wall Street Journal:

Saturday 20 June.  “U.S. stocks ended  lower Friday… worries over Greece sent investors piling into ultrasafe Treasury bonds….”

Tuesday 23 June.  “U.S. stocks advanced Monday…lifted by gains in health-care and financial shares as well as optimism that Greece will eventually reach a bailout deal with its creditors.”

Wednesday 24 June.  “…stocks climb[ed] as Greece moved closer to a bailout deal with creditors.”

Today 25 June.  “U.S. stocks ended lower Wednesday, with the Dow Industrials posting their biggest one-day decline in nearly a month, as recent optimism about a bailout deal for Greece faded.”

Cynicism, of course, was invented in Greece, and today a cynic might wonder if headline writers were using Greece as a catch-all explanation for whatever had happened the day before.  Regardless of tomorrow’s news, we should keep three things in mind:

First, the situation is very fluid, as the Journal’s headlines demonstrate.  One day a compromise is near, the next day Greece and its creditors are back at an impasse.  If the way forward were obvious and clear, the parties would have found it by now.  For anyone not close to the negotiations (and perhaps even for those who are), predictions are necessarily speculative.

Second, there’s good reason to believe that a Greek default, if there is one, will be manageable.  The European financial system is much better able to adjust to default, and a possible “Grexit” from the euro, than it was when Greece’s problems first came to light.  In that sense, as we’ve argued before, a default will be allowed to occur only if it doesn’t really matter.

Third, even if a compromise is reached in the next week, Greece is unlikely to disappear from the headlines.  The Greek problem is inherently political and will require a political solution, and political solutions are seldom final.  Whatever we hear in the next few days, we are unlikely to have heard from Greece for the last time.  Timeo Danaos et dona ferentes.

The posts on this blog are opinions, not advice. Please read our Disclaimers.

What’s Behind Biotech Gains?

Contributor Image
Todd Rosenbluth

Director of ETF and Mutual Fund Research

S&P Capital IQ Equity Research

Biotechnology companies comprised 21% of the S&P 500 Health Care Sector index, making it the second largest industry, behind pharmaceuticals (42%), but ahead of health care providers (19%) and health care equipment & suppliers (14%). The industry has been a top performer in recent years, but S&P Capital IQ sees additional catalysts.

Biotechnology was the best performing industry, up 288.5% from 2011-2014, ahead of the S&P Health Care Sector and the broader S&P 1500 indices gains of 118% and 64%, respectively. Year to date through June 19, the 14% gain for industry ahead of the broader market’s 2.9% return.

According to Jeffrey Loo, S&P Capital IQ’s head of health care equity research, there are a number of catalysts. He highlighted that in 2014 several high profile blockbuster drugs were approved by the Federal Drug Administration (FDA) and sales for the seven biotech companies in the S&P 500 index rose 41.5% in 2014, while net income rose 85%. Looking forward, these companies have robust pipelines, with expectations that 10-12 compounds could be approved by the FDA in 2015 and are capable of achieving blockbuster sales in five years.

While the biotechnology industry has strong growth prospects, Loo points out that Amgen (AMGN) and Gilead Sciences (GILD) also pay dividends comparable to other more mature health care companies. S&P 1500 index biotech companies have a 0.8% dividend yield.

Despite the strong gains for the industry the last few years, biotech is far from expensive in our opinion. Indeed, the S&P 1500 Biotechnology industry trades at forward P/Es of 19.1X (2015) and 15.9X (2016), below that of the health care sector’s 19.7X and 16.8X near the broader S&P 1500 index’s 18.5X and 16.1X, respectively.

In the first five months of 2015, investors focused most of their equity ETF assets toward international products. However, among U.S. sector ETFs, diversified health care and biotechnology specific products were highly popular. Health care ETFs gathered $6.7 billion of fresh money.

S&P Capital IQ has rankings and research on more than 800 equity ETFs based on a review of the underlying holdings and key cost factors. In our research, we have found that some biotechnology and health care ETFs are market cap weighted, while others are equally weighted ad provide more exposure to small- and mid-cap companies. We think investors need to understand what’s inside these largely index-based products.

—————————————————————————————————–

S&P Capital IQ operates independently from S&P Dow Jones Indices.
The views and opinions of any contributor not an employee of S&P Dow Jones Indices are his/her own and do not necessarily represent the views or opinions of S&P Dow Jones Indices or any of its affiliates.  Information from third party contributors is presented as provided and has not been edited.  S&P Dow Jones Indices LLC and its affiliates make no representations or warranties of any kind, express or implied, regarding the completeness, accuracy, reliability, suitability or availability of such information, including any products and services described herein, for any purpose.


The posts on this blog are opinions, not advice. Please read our Disclaimers.