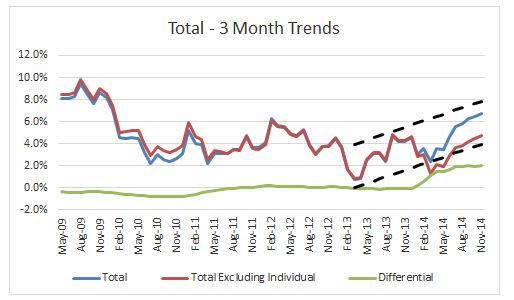
The chart below shows the history of the S&P Claims Based Indices trends for total business and also total business less individual. Up until 2014 the total and the total less individual were generally within a half a percent or so on a three month moving average trend basis. However, with the advent of the ACA in 2014, as individual trends shot up significantly, the gap between total and total less individual increased to about 2% at this point. This does not appear to be just an increase in individual trends, it is accompanied by a significant simultaneous reduction in non-individual trends. Starting in 2014 we have been forecasting trends to begin upward movement as a result of the improved economic recovery, but we have not yet seen any evidence of this on the LG/ASO trends. However, if we look at the total trends in the Chart below we can see that the trends appear to have bottomed out near the beginning of 2013 and have had a consistent upward movement through the available time periods as of November 2014.
We expect that trends will continue their upward movement in total, but the impact on LG/ASO will vary depending upon the results of what happens to individual trends and small group trends in 2015. If individual trends return to more normal levels in 2015 this will likely lead to an upward movement in LG/ASO trends relative to 2014.