Get Indexology® Blog updates via email.

In This List

Blurred Lines: Institutional Adoption of Alternative Beta

Inside the S&P 500: What makes a Company U.S.?

Defaulted Municipal Bonds Outperform!

4 Benefits Offered by Preferred Securities

What Me Worry?

Blurred Lines: Institutional Adoption of Alternative Beta

Contributor Image
Xiaowei Kang

Former Senior Director, Co-Head of Global Research

S&P Dow Jones Indices

Over the recent years, the traditional divide between passive and active management has become increasingly blurred. In particular, institutional investors have shown growing interests in so call “alternative beta” or “smart beta” strategies that aim to deliver better risk adjusted performance than the market by taking active bets on systematic risk factors, while retaining the core benefits of passive investing such as low cost and transparency.

This trend is partly driven by the recognition that systematic risk premia explain the majority of long-term portfolio returns, and that a significant portion of the alpha delivered by active managers can be attributed to these systematic factors. The below Exhibit shows that, over the last 15 years, alternative beta strategies that capture exposures to factors such as value, low volatility, momentum and quality have significantly outperformed the S&P 500 by about 4% per annum.Annualized Return (1998-2013)

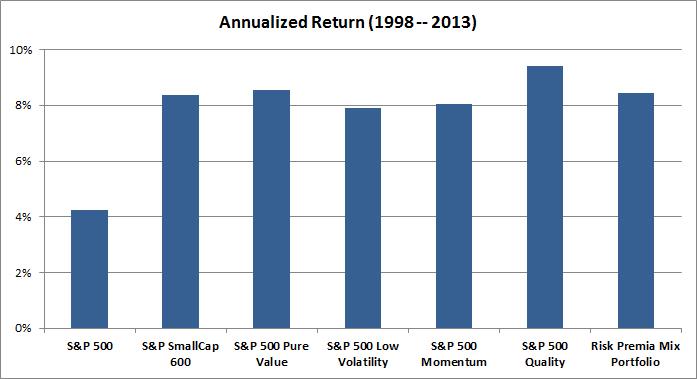
Source: S&P Dow Jones Indices. Data from June 30, 1998 to June 30, 2013. Charts are provided for illustrative purposes. Past performance is not a guarantee of future results. Some data reflected in this chart may reflect hypothetical historical performance.

However, there are many challenges for institutional investors to evaluate and potentially implement alternative beta strategies. For instance, investing in alternative beta strategies involves active decisions and passive implementation, thus may require significantly different investment processes and governance than traditional passive or active mandates. In addition, the recent proliferation of these strategies makes the strategy selection and due diligence process a complex and time-consuming exercise. Last but not least, as risk premia factors are cyclical, these strategies may experience sustained periods of underperformance relative to the market.

Join us for a live 60-minute webinar on December 5, 2013 to hear our panel of industry thinkers from BlackRock, Mercer and S&P Dow Jones Indices discuss the trends, opportunities and challenges in alternative beta investing. Register here.

The posts on this blog are opinions, not advice. Please read our Disclaimers.

Inside the S&P 500: What makes a Company U.S.?

Contributor Image
David Blitzer

Former Managing Director and Chairman of the Index Committee

S&P Dow Jones Indices

The S&P 500 is an index of U.S. companies.  But, exactly what a U.S. company is can be complicated.  Traditionally being U.S. company meant being incorporated in the US. However, in the last few years companies that many think of as being American are not incorporated here.  Nielsen Holding, the company which compiles ratings of television shows and other entertainment is one, Seagate Technology; a manufacturer of computer components is another.  Oil drillers, insurance companies and many more are also US companies incorporated someplace else. On the other hand, there are companies with little business here that incorporate in the U.S. or other developed countries because of the legal system or the financial markets.

All this moving around is recognized by investors who no longer judge which country a company is in only by its incorporation.  Other things are more important: where does the stock trade?  Which country’s financial reporting rules apply? Which regulator will go after the company? Where is the company doing business? Where are its competitors?  All these things matter, often far more than incorporation. Indices and index construction should reflect the markets as seen and understood by investors, not as mapped by the lawyer who filed incorporation papers many years ago.

Over the last several years S&P Dow Jones Indices consulted with investors about the best way to assign companies to countries so that our indices are most useful for analyzing markets and supporting investment products.  The results of this effort can be seen in the methodology for the S&P 500 and our U.S. indices.  These guidelines good back several years and haven’t changed recently.

The approach focuses on some key factors: U.S. companies are listed on either the New York Stock Exchange or NASDAQ and file their financial reports with the SEC as a US company on form 10-K. (Foreign companies often file financials with the SEC, but on a different form). Additionally, we consider where the assets, revenues and employees are located and how corporate governance is structured.  And we do look at where the company is incorporated.

If the index only considered incorporation, several companies and some key industries would be missing from the 500.  And, they might be replaced by companies incorporated here but with little or any local business or employees or presence, or investors, in the U.S.

The posts on this blog are opinions, not advice. Please read our Disclaimers.

Defaulted Municipal Bonds Outperform!

Contributor Image
J.R. Rieger

Former Head of Fixed Income Indices

S&P Dow Jones Indices

Hard to fathom isn’t it!  With 2013 municipal bond default and bankruptcy headlines casting a dark cloud over the municipal bond market, defaulted bonds actually have been up.  The overall performance of defaulted municipal bonds during this time has been positive as the S&P Municipal Bond Defaulted Index has returned a positive 2.79% year to date.  Meanwhile, the investment grade tax-exempt market tracked in the S&P National AMT-Free Municipal Bond Index has seen a negative 2.85% return year to date.

Sectors within the municipal bond market are each unique and have their own set of risks and that holds true for defaulted bonds.  Some of those sectors are down significantly. Healthcare related bonds in default have been down over 8% year to date and multifamily bonds down just under 5%.  These have been offset by a recovery of the distressed corporate backed municipal bond market of over 13% and land backed bonds in distress are up over 7.6%.

The graphs and returns below detail the performance of several municipal bond sectors and the bonds markets in general.

Source: S&P Dow Jones Indices.  Data as of November 20, 2013.
Source: S&P Dow Jones Indices. Data as of November 20, 2013.

Bond Market Performance 11 20 2013

The posts on this blog are opinions, not advice. Please read our Disclaimers.

4 Benefits Offered by Preferred Securities

Contributor Image
Aye Soe

Former Managing Director, Global Head of Core and Multi-Asset Product Management

S&P Dow Jones Indices

  1. Preferred stocks can offer investors greater assurances than common shares in terms of both knowing that they will receive the dividend payment and knowing what the dividend amount will be.  Since preferred securities are higher in seniority than common equities, dividends must be paid to preferred shareholders before common shareholders.  Also, since most preferreds provide a fixed dividend payment, an investor will know what amount to expect at the next payment date.  In times of poor performance, a company will be more likely to either cut the common dividend amount or cancel the dividend altogether, rather than cut the preferred dividend amount.
  2. Historically, preferred stocks have offered higher yields than other asset classes including money market accounts, common stocks and bonds.  For institutions and individual investors seeking current income, the high yields are seen as attractive investments.
  3. In addition to higher yields, preferred stocks have low correlations with other asset classes such as common stocks and bonds, thus providing potential portfolio-diversification and risk-reduction benefits.  It is important to note that preferred securities exhibit higher correlation with high-yield bonds and equities, which are more sensitive to credit, and lower correlation with investment-grade corporate and municipal bonds, which are more sensitive to interest rate risk.
  4. Preferreds have a tax advantage over bonds, as many preferred dividends are qualified to be taxed as capital gains as opposed to bond interest payments, which are taxed as ordinary income.

Contributors:
Phillip Brzenk, CFA
Associate Director, Index Research & Design

Aye Soe, CFA
Director, Index Research & Design

For more on preferreds, read our recent paper, “Digging Deeper Into the U.S. Preferred Market.”

The posts on this blog are opinions, not advice. Please read our Disclaimers.

What Me Worry?

Contributor Image
David Blitzer

Former Managing Director and Chairman of the Index Committee

S&P Dow Jones Indices

U.S. Stocks are up by about a quarter since the start of the year with 472 of the 500 stocks in the S&P 500 up since December 31st, 2012.  IPOs are getting attention following the successful launch of Twitter.  And more commentators and gurus are arguing for further gains, a coming collapse or both. Should we abandon stocks on worries that the bear markets of 2000 and 2007 will return? Or, is it “Damn the torpedoes and full speed ahead” into the stock market?

Two widely-recognized measures of market over- or under-valuation are Robert Shiller’s cyclically adjusted price-earnings ratio, CAPE and Tobin’s Q.  CAPE is a version of the usual ratio of stock price to earnings which uses the inflation adjusted price of the S&P 500 index and divides it by inflation-adjusted earnings per share averaged over the last ten years.  These adjustments usually yield a higher figure than the simple PE. Currently CAPE is about 24 and the usual calculation of the PE is about 17.   The chart, based on data on Shiller’s web site, shows CAPE from 1980 to now.  The average since 1980 is 21. The current level is above the average but not as high as at recent market peaks.

CAPE

Tobin’s Q is the ratio of the market’s value to the replacement cost of the assets of companies in the stock market.  It is something of analogy to a price-to-book value ratio.   The ratio was developed by James Tobin an economist and Yale professor as part of research on financial markets, monetary policy and the economy.  Its current values, like CAPE, are above the long term average but also below historic peaks.  The web site http://advisorperspectives.com/dshort/ often provides comments and updates on Tobin’s Q.

Neither CAPE nor Q react quickly enough to time the market or give buy or sell signals. They do indicate if stock valuations are rising or falling and are high or low compared to long range norms.  Both indicate that stock valuations are higher today than a year ago and certainly higher than in March 2009 when the market bottomed.

If a portfolio was 60% stocks and 40% bonds at the start of the year, it is now 75%/25% with no trading at all.  If an investor was comfortable at 60/40 in January, is he or she comfortable at 75/25?

The posts on this blog are opinions, not advice. Please read our Disclaimers.