Get Indexology® Blog updates via email.

In This List

Gold’s Crash Outshines the Need for Heat

Equity Auguries?

Special Report: US vs. European Banks CDS

Gold No Longer Worth Its Weight

Joining the Index Club

Gold’s Crash Outshines the Need for Heat

Contributor Image
Jodie Gunzberg

Former Managing Director, Head of U.S. Equities

S&P Dow Jones Indices

Year-to-Date S&P GSCI is off 6.81%

  • S&P GSCI Gold had its biggest one day loss ever,-9.3%, on April 15, 2013, since its inception on Jan 6, 1978, and hit its lowest level since Feb 2, 2011. The decline was due to worries about central bank sales, especially from Cyprus, but also, from the Fed winding down bond purchases.  However, buying improved from India ahead of the Akshaya Tritiya, a gold buying festival, next month.  Also, the wedding season has started and will continue until June. The S&P GSCI Silver hit its lowest level on April 19, 2013 since Oct 4, 2010.  On April 15, 2013, the S&P GSCI Silver had its 6th biggest one-day drop, 11.3%,  since its inception on Jan 5, 1973.
  • Weak economic data including cooling factory activity and a rise in jobless claims drove the S&P GSCI Energy down 2.9% last week for a total loss in April of 8.8%.  The S&P GSCI Unleaded Gasoline lost 11.3% MTD after the U.S. Energy Information Administration reported gasoline demand was at a 16-year low. Despite the fall across the energy sector, the S&P GSCI Natural Gas added 4.1% last week bringing the MTD and YTD returns up to 9.2% and 26.7%, respectively. continues to rally from cold weather and high electric power sector demand, especially as stricter environmental rules make coal burning more expensive.
  • Cold weather also increased demand for warm drinks like hot cocoa and coffee as better-than-expected first-quarter North American cocoa grindings rose nearly 6%. Also, Brazil’s coffee areas have moved northwards, so the frost may not affect the crop as much as in past years as the frost-risk period approaches. To sweeten the softs, the harvest of cane and output of sugar was slowed by a very rainy start to April. The S&P GSCI Cocoa, Coffee, and Sugar, are up 6.7%, 2.6%, and 1.3%, respectively MTD.

v\:* {behavior:url(#default#VML);}
o\:* {behavior:url(#default#VML);}
w\:* {behavior:url(#default#VML);}
.shape {behavior:url(#default#VML);}

Normal
0

false
false
false

EN-US
X-NONE
X-NONE

MicrosoftInternetExplorer4

/* Style Definitions */
table.MsoNormalTable
{mso-style-name:”Table Normal”;
mso-tstyle-rowband-size:0;
mso-tstyle-colband-size:0;
mso-style-noshow:yes;
mso-style-priority:99;
mso-style-parent:””;
mso-padding-alt:0in 5.4pt 0in 5.4pt;
mso-para-margin:0in;
mso-para-margin-bottom:.0001pt;
mso-pagination:widow-orphan;
font-size:10.0pt;
font-family:”Times New Roman”,”serif”;}

Index Performance through April, 19, 2013


v\:* {behavior:url(#default#VML);}
o\:* {behavior:url(#default#VML);}
w\:* {behavior:url(#default#VML);}
.shape {behavior:url(#default#VML);}

Normal
0

false
false
false

EN-US
X-NONE
X-NONE

MicrosoftInternetExplorer4

/* Style Definitions */
table.MsoNormalTable
{mso-style-name:”Table Normal”;
mso-tstyle-rowband-size:0;
mso-tstyle-colband-size:0;
mso-style-noshow:yes;
mso-style-priority:99;
mso-style-parent:””;
mso-padding-alt:0in 5.4pt 0in 5.4pt;
mso-para-margin:0in;
mso-para-margin-bottom:.0001pt;
mso-pagination:widow-orphan;
font-size:10.0pt;
font-family:”Times New Roman”,”serif”;}

The posts on this blog are opinions, not advice. Please read our Disclaimers.

Equity Auguries?

Contributor Image
Craig Lazzara

Former Managing Director, Index Investment Strategy

S&P Dow Jones Indices

The market for credit default swaps is typically not well-understood by equity investors (myself emphatically included).  This is unfortunate, since the price of insuring a company’s bonds (which is what a CDS measures) can sometimes provide insight into the same company’s equity securities.

For example, in September 2012, the S&P 500 financials sector began to open up a large performance advantage over the S&P 500, after running neck and neck with the 500 earlier in the year.  But the relative price of insuring financial sector debt began to cheapen dramatically in May, four months before the start of the equity rally, as shown at http://us.spindices.com/documents/research/iis-leading-indicator-or-confirming-evidence.pdf.

More recently, U.S. bank stocks performed much better than their European counterparts in the first quarter of 2013.  This seems appropriate in view of the continuing supply of Cypriot headlines, although it’s notable that until mid-February the Europeans were in the lead.  But the relative cost of insuring European bank debt began to increase in January – well before the equity markets adjusted.  In anthropomorphic terms, the equity and CDS markets temporarily “disagreed;” the disagreement was resolved in February and March when European bank stocks underperformed (by quite a lot).  (See http://us.spindices.com/documents/research/iis-european-bank-woes-reflected-across-asset-classes.pdf for more details.)

It appears, at least on the surface, that in these two cases movements in CDS prices foreshadowed later developments in the equity market.  Of course two anecdotes do not a summer make.  But the interconnections are none the less intriguing.  In a world of integrated capital markets, equity and fixed income markets probably can’t agree to disagree for long.

The posts on this blog are opinions, not advice. Please read our Disclaimers.

Special Report: US vs. European Banks CDS

Contributor Image
J.R. Rieger

Former Head of Fixed Income Indices

S&P Dow Jones Indices

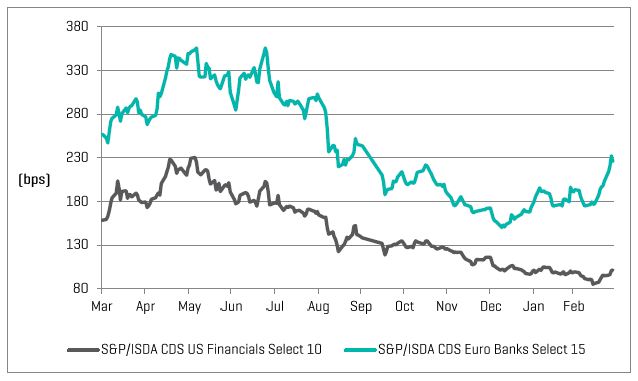
The S&P/ISDA CDS U.S. Financials Select 10 Index held steady widening by a diminutive amount [3bps] for the month of March. The same cannot be said for the S&P/ISDA CDS European Banks Select 15 Index whose spread widened by 35bps in tandem with the news of the banking crisis in Cyprus.

Cypriot banks remained closed fo r a week while the general public waited in long lines to withdrawal a maximum of €300 per person, per day, per bank. It has been reported that the Bank of Cyprus may impose a loss of as much as 60% on accounts above €100,000 in holdings. The country’s second largest bank, Cyprus Polular Bank will be split into a “good” and “bad” bank. The Cyprus government has a €l.L.j billion bond maturing in June [3.75% 6/3/2013] for which funds will be needed. European officials have been taking action to avoid any additional debt problems. To date there have been problems with Cyprus, Greece, Portugal, Ireland and Spain which have all required bailouts.

Constituents to the index such as Banca Monte dei Paschi di Siena and Banco Popolare widened by more than lOObps as their BBB- credit rating puts them right on the cusp of losing an investment grade rating. UniCredit bank paper rated ‘BBB+’ widened by an average of l.jlbps. Single ‘A’ rated and above issuer’s spreads also widened t hough not as dramatic as the ‘BBB’ rated issuers. On average the ‘double A’ and ‘single A’ members of the S&P/ISDA CDS European Banks Select 15 Index were 20bps wider and include some key European banking names such as: Bank of Scotland, Barclays Bank, BNP Pari bas, Commerzbank, Credit Agricole, Credit Suisse Group, Deutsche Bank, HSBC Bank, Lloyds TSB Bank, Royal Bank of Scotland, Societe Generale and UBS.

US_V_European_Banks_CDS_Rieger

SP_ISDA_CDS_EuroBanks_15_vs_US_Financials_10


The posts on this blog are opinions, not advice. Please read our Disclaimers.

Gold No Longer Worth Its Weight

Contributor Image
Jodie Gunzberg

Former Managing Director, Head of U.S. Equities

S&P Dow Jones Indices

Year-to-Date Dow Jones-UBS Commodity Index is off 5.41%

  • Gold, the commodity with the heaviest 2013 target weight in the DJ-UBS CI, no longer is the most heavily weighted commodity in the index, falling from 10.8% to 9.5% since the beginning of the year. The DJ-UBS CI Natural Gas Subindex, the best performer YTD, has now taken over as the most heavily weighted single commodity in the index, rising from a 2013 target weight of 10.4% to 14.7%.
  • Despite the fall across the energy sector, the DJ-UBS CI Natural Gas Subindex added 4.0% last week bringing the MTD and YTD returns up to 9.0% and 25.3%, respectively, as it continues to rally from cold weather and high electric power sector demand, especially as stricter environmental rules make coal burning more expensive. Given the relatively high weight of natural gas, the DJ-UBS CI Energy Subindex is up 4.0% YTD and is the only positive sector in the index.
  • The DJ-UBS CI Precious Metals Subindex, the worst performing sector lost 8.53% this week, causing MTD and YTD returns to be -14.20% and -18.89%, respectively.  DJ-UBS CI Gold Subindex had its biggest one day loss ever,-9.3%, on April 15, 2013 to hit its lowest level since Feb 2, 2011. The decline was due to worries about central bank sales, especially from Cyprus, but also, from the Fed winding down bond purchases.  However, buying improved from India ahead of the Akshaya Tritiya, a gold buying festival, next month.  Also, the wedding season has started and will continue until June. The DJ-UBS CI Silver Subindex hit its lowest level on April 19, 2013 since Oct 4, 2010.
  • To sweeten the softs, the harvest of cane and output of sugar was slowed by a very rainy start to April.  Also, Brazil’s coffee areas have moved northwards, so the frost may not affect the crop as much as in past years as the frost-risk period approaches. The DJ-UBS CI Coffee and Sugar are up 2.6%, and 1.3%, respectively MTD.

Index Performance through April 19, 2013

The posts on this blog are opinions, not advice. Please read our Disclaimers.

Joining the Index Club

Contributor Image
Craig Lazzara

Former Managing Director, Index Investment Strategy

S&P Dow Jones Indices

The Wall Street Journal recently urged its readers to “Beware of Index Funds That Aren’t” (http://on.wsj.com/Xycv7P). If some soi-disant index funds “aren’t,” which ones “are” — or, at the most basic level, what is an index?

A good working definition of an index is this: an index is a portfolio in which constituent and weighting changes are not motivated by alpha-seeking. (Read “alpha” as excess or above-average return.) The contrast with active management is clear; the manager of an active portfolio typically only makes changes that are motivated by alpha-seeking. If not alpha, what objectives might drive the managers of index portfolios? Historically we can identify three stages of index evolution:

  • Asset class replication. A good example here is the S&P 500, which aims to represent the U.S. equity market.
  • Subsets and extensions of basic asset class replication. Examples would include the S&P MidCap 400 or Small Cap 600, as well as sector and style (growth and value) indices.
  • Factor or strategy indices — e.g., the S&P 500 Low Volatility Index or the Dow Jones Select Dividend Index. The distinctive quality of factor indices is that they aim to deliver a particular pattern of returns — in our examples, a pattern characterized by less volatility or higher yield.

It’s this last category whose bona fides the Journal seemed to question, and admittedly the line between active and passive here is a bit more gray. (See, e.g., http://us.spindices.com/documents/research/research-the-limits-of-history.pdf.) But well-constructed factor indices can provide defined patterns of return without requiring the payment of active management fees. This makes them a valuable addition to any passive investor’s toolkit.

The posts on this blog are opinions, not advice. Please read our Disclaimers.