Get Indexology® Blog updates via email.

In This List

In the “Year of Surprises,” UK Bond Markets Manage Their Way

Rieger Report: Could the long end be range bound?

Asian Fixed Income: Did the FOMC Affect Asian Sovereign Bonds?

Employer Self-Insured Trends Still Moving Upward

Our Humble Solution to Unite Europe

In the “Year of Surprises,” UK Bond Markets Manage Their Way

Contributor Image
Heather Mcardle

Director, Fixed Income Indices

S&P Dow Jones Indices

UK bond markets managed to perform well, with significant YTD returns during a year filled with public vote surprises, as well as both rate decreases and hikes globally.  The S&P U.K. Investment Grade Corporate Bond Index had a YTD return of 10.75% as of Dec. 21, 2016, while the S&P U.K. Gilt Bond Index gained 8.72%.  During the same period, corporate bond yields tightened 76 bps and U.K. gilts have tightened 57 bps, but not without some swings in between.

capture

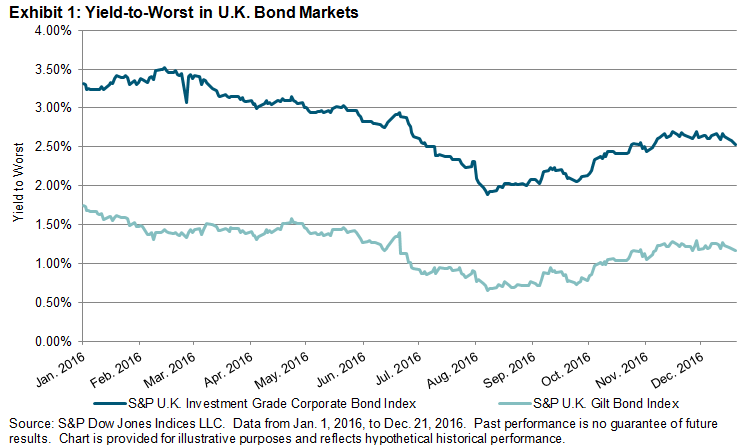
In June 2016, UK bond markets responded to the unexpected Brexit vote by tightening, which equates to bond prices going up and yields going down.  The S&P U.K. Gilt Bond Index tightened 28 bps, as uncertainty over the Brexit’s effect on the UK economy prompted market participants to buy bonds with the highest quality—UK gilts—a phenomenon known as the “flight to quality” effect.  Despite the uncertainty of Brexit’s effect on UK corporations, the S&P U.K. Investment Grade Corporate Bond Index also tightened by a more modest 5 bps.

August saw yields sink to their lowest point of the year (and highest prices) after the Bank of England (BoE) cut rates for the first time in seven years.  Rates were cut to a record low of 0.25% from 0.5%, and the BoE also expanded its quantitative easing program.  Bond markets generally react to the lowering of rates by rallying, causing yields to go down.  The S&P U.K. Gilt Bond Index saw yields as low as 0.65%, while the S&P U.K. Investment Grade Corporate Bond Index was as low as 1.89%.

Moving to November 2016, the surprise win by Trump in the U.S. presidential election saw UK bonds responding mutely, with prices selling off.  UK investment-grade corporate bond yields widened 5 bps and UK Gilts widened 1 bp immediately after the results.  This was attributed largely to comments made by Trump about spending.  A Trump spending spree in U.S. infrastructure would cause an increase in prices, and inflation fears are generally a negative for bond prices.

Rounding out the year, on Dec. 14, 2016, the U.S. Fed increased rates to the range of 0.5%-0.75% in response to a stronger U.S. economy and an increase in U.S. prices.  UK gilts and corporate bond markets widened 8 bps, again in fear that rising rates will put negative pressure on bond markets.  Since this move, UK bond yields have tightened back to levels seen just before the rate increase, indicating that despite rising global rates and inflationary fears, UK bond markets may still have room to rise.

The posts on this blog are opinions, not advice. Please read our Disclaimers.

Rieger Report: Could the long end be range bound?

Contributor Image
J.R. Rieger

Former Head of Fixed Income Indices

S&P Dow Jones Indices

The long end of the yield curve for U.S. corporate and municipal bonds could be held range bound over the next several months as there are various forces at play.

Source: S&P Dow Jones Indices LLC. As of December 30, 2016. Graph shown for illustrative purposes only.

Drivers for yields to rise:

  • Inflation expectations: actual and anticipated inflation can impact bond holders and hits the yields of long term bonds the hardest.
  • Infrastructure programs: uncertainty over how infrastructure improvements will be funded and the potential future new issue supply from such programs could also push yields up.
  • New issue supply could continue to rise. CUSIP Global Services announced in November that requests for CUSIPs on new corporate and municipal debt continues to grow and municipal bond requests hit a new four month high.
  • Specifically impacting municipal bonds is the uncertainty of future tax rates can hold bond prices down and keep yields up.
  • ‘Trump uncertainty’, while not necessarily a defined term, the uncertainty a new president brings is probably the hardest for the market to determine.

Counterbalancing all of this is:

  • The continued search for yield.  Negative and zero yield bonds persist in the global markets and U.S. corporate and municipal bonds have become ‘go to’ asset classes for incremental yield as a result.
  • The strength of the U.S. dollar is a positive for U.S. dollar denominated securities.
  • U.S. corporate and municipal bonds have become part of the “risk off” trade.  Recent dynamics that could disrupt investor behavior include the unknown future risks involving Russia, Syria, and China among others.
  • As yields rise on the long end, U.S. pension and endowment funds may seek out long term bonds to replace the more volatile high dividend stock and other investment alternatives used to generate yield.
  • Supply of new issues could stall for many reasons.  For example, companies repatriating cash or which have already borrowed in the low rate environment may no longer need to borrow further.

Yields for investment grade U.S. Corporate and municipal bonds represented by Yield to Worst as we end 2016: (Data as of December 29, 2016)

S&P 500 Investment Grade Corporate Bond Index:  3.21%

S&P National AMT-Free Municipal Bond index (investment grade):  2.44% (The Taxable Equivalent Yield using a 39.6% tax rate would be 4.04%)

I am sure there are many other drivers and welcome other perspectives and view points.


The posts on this blog are opinions, not advice. Please read our Disclaimers.

Asian Fixed Income: Did the FOMC Affect Asian Sovereign Bonds?

Contributor Image
Michele Leung

Former Director, Fixed Income Indices

S&P Dow Jones Indices

The U.S. Federal Reserve recently announced a rate hike of 0.25%, while indicating more rate hikes are likely in 2017.  As of Dec. 21, 2016, the S&P U.S. Treasury Bond Index had lost 0.58% for the month, bringing its total return to 0.06% YTD, while its yield widened 27 bps to 1.75% in the same period.

On the other hand, the S&P Pan Asia Sovereign Bond Index, which seeks to track the performance of local-currency-denominated sovereign bonds in 10 countries, continued its plunge this quarter, dropping 2.26% for the month and 0.15% YTD as of Dec. 21, 2016.  Asian bond market performance varied, as countries have adopted different monetary policies.  Arguably, some sell-offs may be triggered by the strengthening of the U.S. dollar, but the historical correlation of the S&P Pan Asia Sovereign Bond Index with the S&P U.S. Treasury Bond Index had been low, in the range of 0.34-0.44.

The correlations of China and India with the U.S. were much lower, largely because their bond performances were mainly driven by their central banks and domestic fundamentals.  The sovereign bonds from some Asian countries like Singapore and South Korea had higher correlations with U.S. Treasury bonds, but they were of smaller significance within the index due to their relatively smaller market values.

The Bank of Japan maintained its key policies—a negative interest rate at -0.1% and the use of asset purchase programs to boost the economy.  The S&P Japan Sovereign Bond Index dropped 0.61% for the month and 1.49% YTD as of Dec. 21, 2016, while its yield tightened by 20 bps to 0.05%, after spending eight months in negative-yield territory.  Interestingly, despite opposite movement in interest rates, the correlation of the S&P Japan Sovereign Bond Index and S&P U.S. Treasury Bond Index increased to 0.69 in the past year.

20161223

The posts on this blog are opinions, not advice. Please read our Disclaimers.

Employer Self-Insured Trends Still Moving Upward

Contributor Image
Glenn Doody

Vice President, Product Management, Technology Innovation and Specialty Products

S&P Dow Jones Indices

According to the S&P Healthcare Claims Indices, employers should be cautious about getting comfortable with trends in the 4.5%-5% range.  While the most recent data indicates that trends dropped from almost 5% in June 2016 to around 4.5% in July 2016, the overall movement of the trend is still upward.  The S&P National Medical Healthcare ASO Claims Index has been steadily gaining since January 2015, when it reached a low of 1.73% on a national basis (see Exhibit 1).  Over this period of time, the trend has moved in a narrow corridor, approximately 100 bps wide.  Other than three individual months where the trend moved 0.63% (May 2016) and 0.68% (February and November 2015), it has not deviated more than 0.50% in any given month.  In fact, the average trend change over that period has been an increase of 0.19%.  What happens if it continues to move in this corridor over the next 12 to 24 months?  If this were to happen, then in 12 months’ time, the trend could be between 5.76% and 6.76%, and by July 2018, it could be between 7.56% and 8.56%.  This represents a significant change from where the trend is today.  Of course, many market factors could play a role to change the current pattern.  In the next post, we will look at some select geographies across the U.S. to study their change in trends over the past several years.

capture

The posts on this blog are opinions, not advice. Please read our Disclaimers.

Our Humble Solution to Unite Europe

Contributor Image
Reid Steadman

Former Managing Director, Global Head of ESG & Innovation

S&P Dow Jones Indices

Henry Kissinger famously said, “Who do I call if I want to speak to Europe?” In the world of investments, a similar question could be asked, “What index do I use if I want to invest in Europe?” The answer isn’t apparent, and this is why: the leading regional index in Europe, the EURO STOXX 50, doesn’t represent all of developed Europe.

This is a problem and an opportunity. It’s a problem because investors don’t realize the full network effects of relying on one index standard. Though the EURO STOXX 50 is the top index, investors use many indices to get exposure to this region. The result is a fragmented index landscape.

On the other hand, it’s an opportunity for an index provider to step forward to unite Europe by establishing a solution that is both representative of the region in its entirety and an efficient underlying for derivatives and other financial products.

Though establishing a new index standard may seem an impossible mission, we are regularly approached by investment banks and asset managers who are interested in a change. With this in mind, it’s worth considering from time to time what the ideal index landscape for Europe should be and whether the investment community can take steps to achieve it. Solutions already exist. We feel that S&P Dow Jones Indices has a strong candidate in the S&P Europe 350. The challenge is to elevate an index like this for the market to rally around.

A New Standard for Europe
The EURO STOXX 50 is the leading index for futures and options trading, as well as the leading index for ETF assets in the region. The main advantage of this index is its efficiency. The index has, of course, 50 constituents that are easily bought and sold and therefore represent a hedgeable underlying for financial products. The major downside to this index is that it only represents the Eurozone, and therefore excludes major markets such as the United Kingdom and Switzerland.

The S&P Europe 350, on the other hand, includes securities from every developed market but still contains a manageably low number of constituents. It covers 81% of Europe’s market capitalization using only 20% of the region’s tradable securities. The country weightings of the S&P Europe 350 are roughly in line with the broad universe, while the EURO STOXX 50 is weighted much differently. The table below that compares these indices with the S&P Europe Broad Market Index illustrates this.

Country S&P Europe 350 S&P Europe BMI EURO STOXX 50
Austria 0.2% 0.5%
Belgium 2.2% 2.3% 3.7%
Denmark 2.6% 2.7%  –
Finland 1.5% 1.8% 1.2%
France 15.4% 14.7% 37.0%
Germany 14.1% 13.6% 33.1%
Ireland 1.1% 1.2% 1.3%
Italy 3.4% 3.6% 4.5%
Luxembourg 0.4% 0.4%  –
Netherlands 4.9% 5.3% 9.5%
Norway 0.9% 1.4%
Portugal 0.2% 0.3%
Spain 4.7% 4.8% 9.8%
Sweden 4.6% 5.3%
Switzerland 14.4% 13.4%
United Kingdom 29.6% 28.8%
100% 100% 100%

Sources: S&P Dow Jones Indices, STOXX Ltd.

Though these three indices – the S&P Europe 350, S&P Europe BMI, and the EURO STOXX 50 – are highly correlated, the EURO STOXX 50 has underperformed, with higher levels of risk.

Data as of Oct 31, 2016 (Euros, TR) S&P Europe 350 S&P Europe BMI EURO STOXX 50
Annualized Returns
1 Year -6.33% -5.59% -7.95%
3 Year 4.90% 5.68% 2.62%
5 Year 10.31% 11.07% 8.28%
10 Year 2.98% 3.42% 0.41%
Annualized Risk
3 Year 12.96% 12.69% 14.92%
5 Year 11.85% 11.68% 14.62%
10 Year 15.35% 15.52% 18.28%
Risk Adjusted Return
3 Year 0.38 0.45 0.18
5 Year 0.87 0.95 0.57
10 Year 0.19 0.22 0.02

Sources: S&P Dow Jones Indices, STOXX Ltd.

A Change is Needed and Will Come
Europe needs an index that balances efficiency and breadth such that investors enjoy the benefits of both. We are speaking with major product providers and institutional investors about the S&P Europe 350 as a solution. A change from the current indices won’t happen soon, but it will eventually come, and when it does, we will wonder why we didn’t make the switch sooner.

The posts on this blog are opinions, not advice. Please read our Disclaimers.