Get Indexology® Blog updates via email.

In This List

Do Friendly Bears Exist?

The S&P 900 Dividend Revenue-Weighted Index: A Standout Performer in a Challenging Year for Equity Markets

Indexing’s Evolution in Indian Markets

Latin America in the Long Term: A Potential Application of U.S. Equities

Commodities Outperform for the Second Year in a Row

Do Friendly Bears Exist?

Contributor Image
Sherifa Issifu

Senior Analyst, U.S. Equity Indices

S&P Dow Jones Indices

“Never sell the bear’s skin before one has killed the beast.”

Jean de La Fontaine.

On Wall Street, bear markets represent declines of at least 20% from their highs. But on Main Street, bears are anthropomorphized as friendly. Here we look at whether bears can also be “friendly” in financial markets, looking at the S&P 500®’s bear markets to assess what periods of pessimism have told us, historically, and whether there may be glimmers of hope.

A tumultuous 2022 resulted in the S&P 500 entering a bear market and posting its worst calendar year performance since 2008, down 18%, bringing an end to its three-year winning streak. The picture could have been grimmer had it not been for an early rally  in October and November; the S&P 500 was down more than 25% at its worst point.  Exhibit 1 shows that the S&P 500’s reached only one all-time high during 2022 (on Jan. 3), the fewest all-time highs in a year since 2012.

Investors may be forgiven for forgetting what it feels like to be in a bear market. The S&P 500’s longest bull market, which began after 2008’s Global Financial Crisis (GFC), was followed by the shortest bear market in history. Exhibit 3 shows that the current 2022-23 bear market’s 20% decline hasn’t reached the same magnitude as the 2020 COVID-19 sell-off or 2008 GFC, which recorded declines of 34% and 57%, respectively. However, 2022’s bear market is already 11 times the length of 2020’s COVID correction.

Overall, the S&P 500’s 14 bear markets since 1928 lasted an average of 19 months and were accompanied by an average peak-to-trough performance of -38% (see Exhibit 3).

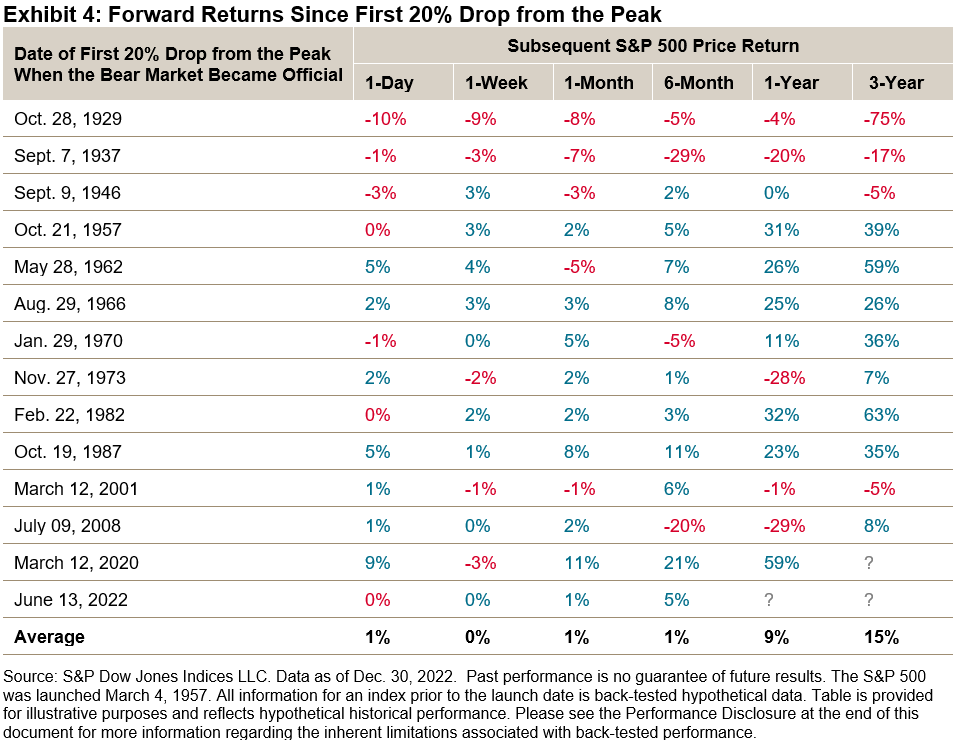
However, market participants can take one silver lining from history—the S&P 500 has typically rebounded from major drops over medium horizons. For example, Exhibit 4 shows that the S&P 500 gained an average of 15% over the three-year period following the beginning of a bear market, and the index typically exhibited a positive return. While history shows the importance of treading with caution in bear markets, a friendly reminder is that at the end of every bear market, a bull market begins and all things pass in time.

The posts on this blog are opinions, not advice. Please read our Disclaimers.

The S&P 900 Dividend Revenue-Weighted Index: A Standout Performer in a Challenging Year for Equity Markets

Contributor Image
Wenli Bill Hao

Director, Factors and Dividends Indices, Product Management and Development

S&P Dow Jones Indices

2022 was a difficult year for equity investors as rising interest rates, increasing geopolitical risks and slowing economic growth put downward pressure on equities. However, factors such as dividend yield and value fared much better than the broader equity market due to their shorter durations.  Despite this challenging economic environment, the S&P 900 Dividend Revenue-Weighted Index posted an impressive 7.57% in 2022, representing 25.39% outperformance versus its benchmark. In this blog, we will analyze this index’s methodology and examine the dividend yield and value tilts, all of which contributed to its outperformance.

Methodology Overview

To avoid value traps, the methodology begins by excluding the top 5% of stocks based on: (1) the average 12-month trailing dividend yield in the universe; and (2) the last 12-month dividend payout ratio in a GICS® sector. Additionally, only stocks that currently pay a dividend and have had positive revenue over the last 12 months are eligible.

Next, the index selects the top 60 stocks with the highest dividend yield within the eligible universe. These constituents are then weighted by their revenue for the trailing four quarters, with an individual constituent weight cap of 5%. This fundamental weighting approach, rather than a market-cap approach, gives the index a value tilt.

Historical Impact of Dividends on Total Return

Exhibit 2 shows the performance from June 30, 2003, to Dec. 31, 2022. Over this period, the S&P 900 Dividend Revenue-Weighted Index posted a total return of 540.75% and a price return of 159.35%. Over the same period, the S&P 900 generated a total return of 489.32% and a price return of 303.49%.

As of Dec. 31, 2022, the S&P 900 Dividend Revenue-Weighted Index’s trailing one-year dividend yield was 3.99%, versus 1.74% for the S&P 900. Such dividend yield advantage, compounded and reinvested over many years, is a key determinant for the long-term total return outperformance of the S&P 900 Dividend Revenue-Weighted Index compared with its benchmark.

Historical Performance in High-Inflation Environments

Given the current inflationary environment, it is important to understand how the S&P 900 Dividend Revenue-Weighted Index has historically performed relative to its benchmark in similar economic climates. High-inflation periods are defined as at least 10 consecutive months where the year-over-year CPI rate exceeds 3%. Exhibit 3 shows that the S&P 900 Dividend Revenue-Weighted Index outperformed its benchmark in all four recent inflationary environments.

Sector Composition

Over the long term, Exhibit 4 shows that the S&P 900 Dividend Revenue-Weighted Index was overweight in the Utilities and Communication Services sectors (driven by the Telecommunication Services and Media industries) and underweight in Information Technology, Industrials and Health Care.

Factor Exposure

From a long-term factor perspective, the S&P 900 Dividend Revenue-Weighted Index has demonstrated a value tilt, as shown in Exhibit 5. Using Axioma Risk Model Factor Z-scores from June 30, 2003, to Dec. 31, 2022, the S&P 900 Dividend Revenue-Weighted Index had higher exposure to the book-to-price and dividend yield factors, similar exposure to earnings yield and lower exposure to growth factors such as sales and earnings growth when compared with the S&P 900.

Conclusion

The S&P 900 Dividend Revenue-Weighted Index has demonstrated solid outperformance over the long term, as well as in previous and current inflationary environments. Additionally, its emphasis on dividend yield and value could offer investors more protection against rising interest rates relative to its benchmark. For market participants who believe that the current economic environment may persist, the S&P 900 Dividend Revenue-Weighted Index might be an option worth considering.


The posts on this blog are opinions, not advice. Please read our Disclaimers.

Indexing’s Evolution in Indian Markets

Contributor Image
Koel Ghosh

Former Head of South Asia

S&P Dow Jones Indices

Indexing, also known as index-based or passive investing, has been slowly but steadily growing and transforming asset management and financial markets in India. For more than a decade, there has been a strong preference for actively managed funds among Indian investors, and understandably so as historically these were the only financial products that dominated the market for a long time.

However, in recent times, investors’ appetites have been shifting to index-based strategies with the increasing availability of independent, transparent, and rules-based global, regional and local indices, along with market benchmarks in the country and, more broadly, the Asia-Pacific region.

Indeed, based on AMFI data, there has been a significant shift in the last few years, and investor interest in index-based or passive strategies is reflected in the growth of assets under management in index-based products such as exchange-traded funds. For example, 294 index-based products with aggregate assets of INR 6.46 lakh crore account for 16% of the total industry as of November 2022. If we compare this to the number from two years ago in 2020, the passive market accounted for only 9% of the total asset management industry, with 136 products and assets totaling INR 2.6 lakh crore.

The number of index-based products has doubled, and assets have increased over 2.5 times. The five-year growth story in assets and products has been exponential; while allocations to passive strategies previously made up a mere 3% of the total asset management industry in 2017—with 67 products and assets totaling INR 0.75 lakh crore—the assets in the market today reveal it has expanded 8 times.1

The benefits of indexing, including transparency, lower costs, and efficiency, have helped fuel the steady growth of indexing in the Indian market. The growth trends are the same in key markets globally, especially in the U.S., where the adoption of indexing is more advanced. In fact, according to S&P Dow Jones Indices’ own estimates based on data derived from our core U.S. equities indices—the S&P 500®, S&P MidCap 400® and the S&P SmallCap 600®—indexing has saved investors more than USD 403 billion in active management fees over the past 26 years.

The performance of index-based funds versus actively managed funds is another key growth driver. For two decades now, S&P DJI has been tracking and comparing the performance of actively managed funds versus their respective benchmarks via its biannual S&P Indices Versus Active (SPIVA®) Scorecard, which has been the de facto scorekeeper of the ongoing active versus passive debate since its first publication in 2002. S&P DJI currently tracks performance data and publishes these scorecards in select markets in the Americas, Europe, Middle East and Africa and APAC, including India.

While the results are not always the same, SPIVA Scorecards in the key markets S&P DJI follows displayed a common trend of actively managed funds trailing their benchmarks by 50% in the one-, three- and five-year categories in most countries (see Exhibit 1). As per the mid-year 2022 scorecards, this trend was particularly prevalent in the U.S., Mexico, Chile, Brazil, MENA, Europe, Japan, and India. The only exception among the mid-year 2022 reports were Canada, South Africa, and Australia.

More specifically, the SPIVA India Scorecard has provided a semiannual update on the active versus indexing debate in India since 2013. The India scorecard compares the performance of actively managed Indian mutual funds with S&P DJI benchmarks in their respective categories. In the long term, the majority of the active funds have not been able to outperform the benchmark since 2016, as shown by the 10-year data. The three- and five-year categories also displayed the most instances of over 50% underperformance of active funds since 2016. In particular, the year-end 2018 and mid-year 2022 scorecards showed the remarkable outperformance of the S&P BSE 100 compared with active funds of over 80% in the same categories.

The landscape for indexing is shifting rapidly. Not only are assets growing, but the variety of indexing choices is also growing—moving from core equities to market beta products, to sectors and factor-based indices. Factor indices such as low volatility, quality, momentum, and value are picking up wide interest as well. In addition, diversification and exposures to international indices are also making their way into passive or index-based strategies in India. As the understanding and knowledge of the benefits of index-based investing grows, there is further potential for expansion in India and globally.

1 Source: AMFI, https://www.amfiindia.com/research-information/amfi-monthly

The posts on this blog are opinions, not advice. Please read our Disclaimers.

Latin America in the Long Term: A Potential Application of U.S. Equities

Contributor Image
Cristopher Anguiano

Senior Analyst, U.S. Equity Indices

S&P Dow Jones Indices

2022 was a challenging year for equity markets, as central banks around the world hiked interest rates in response to surging inflation. U.S. equities were affected by the souring sentiment, with the S&P Composite 1500® down 17.8% in 2022. More broadly, all 25 countries in the S&P Global Developed BMI declined in U.S. dollar terms since the end of 2021, while 15 out of 24 S&P Emerging BMI countries declined by the same measure. However, Latin American equities had a stronger year than most regional markets: Exhibit 1 shows that equity markets in Argentina, Chile, Brazil and Peru increased in U.S. dollar terms last year.

Sector exposures were a key reason for performance differences in 2022. Exhibit 2 shows that many Latin American countries benefitted from having more (less) exposure to out- (under-) performing GICS® sectors compared to the S&P 1500™. Indeed, Latin American countries typically had greater weight in Energy, Financials, Materials and Consumer Staples, and less exposure to Information Technology and Consumer Discretionary.

Although the outperformance of domestic equity markets may be well received by investors across Latin America, some may wish to take a longer-term perspective. Over long-term horizons, the S&P Composite 1500 showed higher returns and lower risk compared to the country-specific indices. Exhibit 3 shows the rolling five-year risk-adjusted returns, where U.S. equities posted a higher return per unit of risk.

Combined with the less-than-perfect correlation between the performance of the S&P Composite 1500 and various countries in Latin America, it is unsurprising that Exhibit 4 shows that adding a U.S. equity allocation to a domestic equity allocation could have improved risk-adjusted returns, historically.

As a result, Latin American equity indices outperformed in 2022, as they benefitted from having less exposure to sectors that were most affected by higher interest rates. However, U.S. equities may still be relevant to investors in Latin America.  Combining U.S. equity exposures with a domestic equity allocation could have improved risk-adjusted returns, historically, and the U.S. market’s distinct sector exposures could help mitigate domestic sector biases.

The posts on this blog are opinions, not advice. Please read our Disclaimers.

Commodities Outperform for the Second Year in a Row

Contributor Image
Fiona Boal

Managing Director, Global Head of Equities

S&P Dow Jones Indices

The market standard commodities benchmark, the S&P GSCI, performed admirably in 2022, rising 26%, outpacing other commodities indices and asset classes, as well as defying higher interest rates and growing fears of a prolonged global economic slowdown, while high inflation provided a solid backdrop for one of the most inflation-sensitive asset classes. Commodities has been the best-performing major asset class for each of the past two years.

It is not surprising that the energy complex enjoyed the strongest performance across commodities markets in 2022, with the S&P GSCI Petroleum rallying 44.6%. Oil prices surged in March as the Russia-Ukraine conflict disrupted global oil trade flows, but prices reversed in the second half of the year as recession risks multiplied. At the end of December, Russia delivered its long-awaited response to the Western price cap, announcing that it would ban the supply of oil and oil products for five months to countries that are party to the cap, starting on Feb. 1, 2023.

It was a wild ride for natural gas in 2022; the S&P GSCI Natural Gas ended the year up 19.8%, following a decline of 33.5% in December. Supply disruptions due to the Russia-Ukraine conflict sent global gas markets into override, but prices have more than halved since their mid-year highs, with stronger U.S. production and milder weather contributing to the reversal.

Despite starting the year with solid gains, industrial metals ended the year in negative territory, with the S&P GSCI Industrial Metals declining 7.6%. Inflation, COVID-19 lockdowns in top consumer China and coordinated interest rate rises hampered economic growth and weakened demand for industrial metals used in the power and construction industries, such as copper. 2022 will also be remembered as the year that the nickel market was rocked by a period of disorderly trade on the LME, leading to elevated periods of volatility and a slump in liquidity.

Performance across the agricultural markets was mixed. An ongoing drought in top soybean meal exporter Argentina and less competition from alternative oils such as sunflower and palm supported soybean prices, with the S&P GSCI Soybean ending the year up 28.9%. Wheat prices jumped to an all-time high following the Russian-Ukraine conflict (both major exporters of wheat). However, Black Sea exports picked up in the second half of the year, helped by a deal to create a safe shipping corridor for Ukrainian wheat and a record Russian harvest, ensuring that the S&P GSCI Wheat ended the year down 2.7%. Sugar racked up its fourth consecutive year of annual gains, while caffeine fans should be heartened by the fact that coffee was the worst performer in the S&P GSCI in 2022, falling 21.9%.

With the USD posting its biggest annual gain since 2015 and interest rates rising, it was no surprise that the yellow metal had a lackluster year. The S&P GSCI Gold ended 2022 down a little less than 1.0%. That said, gold performed admirably in the final few months of the year on expectations that the U.S. Fed could begin to scale back the pace of its interest rate hikes, strong central bank purchases and the ongoing challenges in the cryptocurrency ecosystem.

The S&P GSCI Livestock eked out a gain of 4.8% in 2022. Lean hogs were the best performer, benefitting from tight supplies and less competition from poultry.

To learn more about the S&P GSCI and related indices, check out our Commodities Theme Page.


The posts on this blog are opinions, not advice. Please read our Disclaimers.