Get Indexology® Blog updates via email.

In This List

As the UK Targets Net Zero by 2050, the S&P UK PACT Indices Can Too

Any Volunteers? Transparency in Voluntary Carbon Markets

Moonshots: A Proposition for 2022 and Beyond

Powering Up the European Energy Markets with the S&P GSCI Power Indices

Oil, Gas, and ESG: S&P Europe 350 ESG Index Increased Sensitivity (or Lack Thereof)

As the UK Targets Net Zero by 2050, the S&P UK PACT Indices Can Too

Contributor Image
Ben Leale-Green

Former Associate Director, Research & Design, ESG Indices

S&P Dow Jones Indices

The UK set goals of reaching net zero targets by 2050; these targets include transitioning to cleaner power and a more sustainable future, securing 440,000 well-paid jobs, and protecting the British consumer from global fossil fuels price spikes.1

The UK equity market certainly has some work to do, given its high weight in carbon-intensive sectors, compared with the rest of Europe and the U.S.

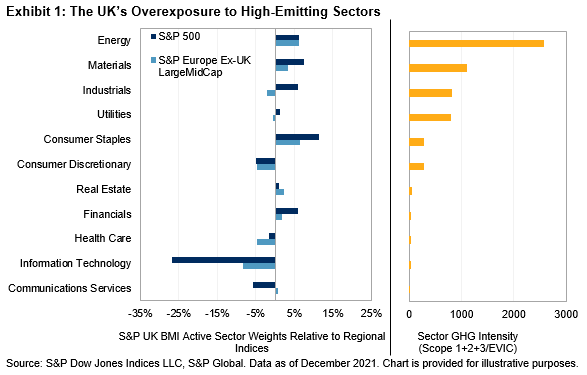
Larger weights in highly intensive sectors are reflected in the high weighted average carbon intensity across sectors in the UK (see Exhibit 2). This tests the efficiency and flexibility of the S&P PACT™ Indices (S&P Paris-Aligned & Climate Transition Indices) methodology, as many stocks must be removed due to the strict fossil fuel exclusions required by the EU’s minimum standards for Paris-aligned benchmarks.2

While net zero alignment may be a key target, it isn’t the only climate or ESG concern. Climate change potentially exposes market participants to transition and physical risks, while broader ESG factors may be ethically desirable, financially material, or both. Many of these ESG factors are uncorrelated,3 so gaining exposure to one likely doesn’t provide exposure to the others without explicit control.

S&P DJI offers two approaches that seek to align with a targeted climate scenario, alongside other ESG objectives: 4

  1. S&P UK Net Zero 2050 Paris-Aligned ESG Index
  2. S&P UK Net Zero 2050 Climate Transition ESG Index

The S&P PACT Indices represent a sophisticated strategy, targeting a 1.5°C scenario/2050 net zero compatibility. Additionally, the indices aim to meet the EU minimum standards for Climate Transition benchmarks (CTBs) and EU Paris-aligned benchmarks (PABs) and the Task Force on Climate-related Financial Disclosures (TCFD) recommendations as efficiently as possible, allowing for broad, diverse indices.

Undesirable exposures are excluded, then remaining constituents are reweighted (see Exhibit 3). This reweighting, framed within the TCFD recommendations on climate-related financial risks and opportunities, allocates toward companies that are more compatible with a 1.5°C scenario, green-revenue driven, science-based target setters, and have high ESG scores, while reweighting away from those with high greenhouse gas (GHG) intensity, potential physical risk exposure, and fossil fuel reserves—while maintaining high climate impact exposure.

The S&P PACT Indices are designed to be 1.5°C scenario and 2050 net zero compatible by reducing GHG emissions intensity against the underlying index (30% for CTB-aligned indices and 50% for PAB-aligned indices) and subsequently decarbonizing by 7% year-on-year. Additionally, a forward-looking academic model-based measure assigns companies their fair share of the global 1.5°C carbon budget, while incorporating companies’ forward-looking decarbonization targets.

How have they performed historically? Both the Paris-aligned and climate transition index variants have shown an excess return over the underlying index (see Exhibit 4), with lower volatility (see Exhibit 5).

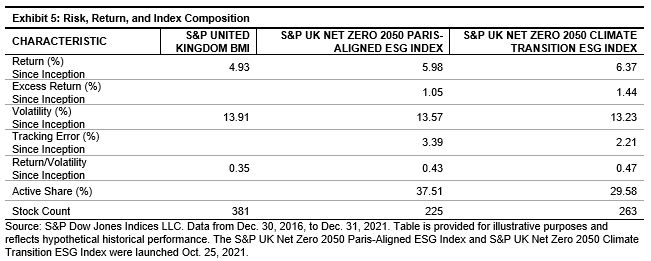
Interestingly, the S&P UK Net Zero 2050 Paris-Aligned ESG Index has had a statistically significant and economically meaningful small size exposure, unseen in the climate transition index (see Exhibit 6). This can likely be explained by the extra exclusions the Paris-aligned index makes, which led to the removal of five of the nine largest companies, accounting for over 15% of the index weight. The S&P UK Net Zero 2050 Climate Transition ESG Index’s factor exposures have been more in line with the benchmark.

Overall, the UK equity market has been characterized by highly carbon-intensive sector exposures, a test of the S&P PACT Index methodology’s efficiency. The S&P UK PACT Indices have been up to the task, offering benchmark-like characteristics while aligning with net zero by 2050, TCFD recommendations, and broad ESG objectives.


1 This net zero target and the impacts are stated by the UK government.

2 Regulation (EU) 2016/1011

3 Exploring S&P PACT Indices Weight Attribution (Leale-Green & Velado, 2019)

4 We offer two approaches within the U.K. Other regional variants are also live.

The posts on this blog are opinions, not advice. Please read our Disclaimers.

Any Volunteers? Transparency in Voluntary Carbon Markets

Contributor Image
Jim Wiederhold

Former Director, Commodities and Real Assets

S&P Dow Jones Indices

The S&P GSCI Nature-Based Global Emissions Offsets and the S&P GSCI Global Emissions Offsets are the first two indices launched by S&P DJI that are based on voluntary carbon markets. The first compliance-based index, the S&P GSCI Carbon Emissions Allowances (EUA) was launched two years ago and tracks the EUA futures based on the European Union’s emissions trading system. Our two new indices bring transparency to a fast growing and highly important new commodity directly tied to the green transition. In contrast to compliant markets like EUAs, voluntary carbon markets are not government mandated, but go through stringent verification and validation channels to ensure underlying projects do indeed have an impact—whether that be reforestation, avoided deforestation, renewable energy, or carbon capture, among others. The S&P GSCI Nature-Based Global Emissions Offsets tracks the CBL Nature-Based Global Emissions Offset (NGO) futures underpinned by the Verified Carbon Standard registry. The S&P GSCI Global Emissions Offsets tracks the CBL Global Emissions Offset (GEO) futures, allowing delivery from CORSIA-eligible carbon offset credits from all three registries displayed in Exhibit 1.1 Both futures contracts are traded at the CME.

The underlying futures contracts from the CME are some of the newest offerings in the carbon market. The speed with which liquidity has built in these contracts echoes the uptake in Bitcoin futures during 2021. Similar to other carbon markets and several other commodities late last year, the voluntary carbon markets experienced significant price appreciation as liquidity and interest drove prices higher. As of Feb. 22, 2022, these two new indices returned more than 200% within only a few months of trading on the underlying futures contracts (see Exhibit 2).

There is significant demand for liquid alternatives in the current market environment, especially for options that allow market participation in the energy transition. Due to the low daily correlations to other carbon markets and other major assets classes, voluntary emissions offsets may offer diversification and potential reduction of overall portfolio risk. Exhibit 3 highlights the low correlations these two new indices demonstrate compared to the European compliance scheme, as well as broad commodities and equities.

Regardless which path the global energy transition takes, transparent and liquid carbon markets are an essential component. There are many hurdles to overcome in this multi-generational shift in global energy consumption, but currently lower-cost resolutions like voluntary carbon markets could continue to gain importance as the most frictionless solution for many market participants. For more information, visit our commodities investment theme page and check out S&P Global Platts’ energy transition resources.

1https://verra.org/project/vcs-program/

https://americancarbonregistry.org/carbon-accounting/standards-methodologies/american-carbon-registry-standard

https://www.climateactionreserve.org/how/voluntary-offset-program/

The posts on this blog are opinions, not advice. Please read our Disclaimers.

Moonshots: A Proposition for 2022 and Beyond

Contributor Image
Srineel Jalagani

Senior Director, Thematic Indices

S&P Dow Jones Indices

The S&P Kensho Moonshots Index (the Moonshots index) is an innovative strategy that aims to gain exposure to the most innovative companies in their early stages of growth.1 Our earlier publication2 showcased the ability of the Moonshots index to harvest the premium of early-stage innovation companies versus their more established counterparts. Innovation as a theme continues to grow, as both companies and consumers navigate the economic and behavioral impacts from COVID-19.

Recent Moonshots index performance has been volatile, with December 2021 and January 2022 witnessing significant negative monthly returns compared with the index’s history (see Exhibit 1). The index’s performance versus the S&P SmallCap 600® benchmark was analogous, with the Moonshots index posting significantly negative returns (see Exhibit 2). Despite this latest bout of volatility, the Moonshots index value as of Feb. 16, 2022 remains above (about 15%) its pre-pandemic level.

Given the novel focus of the Moonshots index, an ideal comparative performance benchmark is difficult to come by. Nonetheless, a popular and similar-themed ETF product from ARK Invest (ARKK) has also been buffeted by market volatility, retracing most of its 2021 gains. The performance of the Moonshots index and ARKK have closely tracked each other since the pandemic started (see Exhibit 3), in addition to having similar volatility profiles (see Exhibit 4). However, we should note that ETF performance and index performance may be materially different in that index performance does not reflect management fees, trading costs, or other expenses.

Despite recent performance headwinds, Moonshots as an investment theme could be an appealing proposition for the following reasons.

  • A Unique Set of Holdings: The constituents of the Moonshots index are a unique set of stocks that offer potential diversification benefits. There is minimal overlap between this set of index constituents and some of the popular benchmarks and thematically comparable ETFs (see Exhibit 5).

  • Diversification: The Moonshots index’s rules-based construction reduces concentration, mitigating the likelihood of overall index performance driven by a select few stocks. The top 5/10 stocks in the 50-stock Moonshots index account for 14%/27% of the index weight. In contrast, the ARKK actively managed 44-stock portfolio allocates 33%/55% of its total weight to the top 5/10 stocks.
  • Capturing Growth: The Moonshots index’s emphasis on innovation guides its natural overweight to the growth factor. The index is heavily tilted toward Information Technology and Industrials, the more growth-exposed sectors of the economy. This is also apparent from the index’s close correlation with a proxy for growth performance (see Exhibit 6).

  • Harvesting Size Premium: The Moonshots index’s methodology focuses on smaller capitalization securities that are in their early stages of expansion. The weighted average market cap of the Moonshots index is USD 2.6 billion compared with USD 644 billion for the S&P 500. Size bias is a concept that has been well documented3 as a systematic strategy that can reap benefits over the long term.


1 https://www.indexologyblog.com/2020/11/12/measuring-innovation-essential-insights-in-an-era-of-disruption-to-the-global-economy/

2 https://www.indexologyblog.com/2020/11/30/moonshots-catching-lightning-in-a-bottle/

3 A five-factor asset pricing model, Eugene F. Fama, Kenneth R. French, 2015

The posts on this blog are opinions, not advice. Please read our Disclaimers.

Powering Up the European Energy Markets with the S&P GSCI Power Indices

Contributor Image
Jim Wiederhold

Former Director, Commodities and Real Assets

S&P Dow Jones Indices

On Feb. 21, 2022, S&P Dow Jones Indices (S&P DJI) launched a series of S&P GSCI European Power Indices, the first indices of their kind in the market and an expansion of the single-commodity offering of indices based on the S&P GSCI. The S&P GSCI European Power Indices are designed to provide reliable and publicly available performance benchmarks for the largest European power markets. The indices are based on European Energy Exchange (EEX) quarterly and annual French, German, Italian, and Spanish power futures.

As the green energy transition takes hold globally, liquidity of financial instruments is crucial to ensure the shift from fossil fuels to renewables is as seamless and efficient as possible. The power markets will likely play an important role in that regard. Record natural gas and electricity prices in Europe, record coal prices in China, multi-year-high natural gas prices in the U.S., and Brent crude prices topping USD 90 per barrel are all manifestations of a global energy shortage that has come into sharp focus over recent months. Until now, the power segment has been an inaccessible commodity for many market participants. As illustrated in Exhibit 1, price discovery in the European power markets in the fall of 2021 was rapid and efficient.

Market participants can track electricity in Europe via the futures market, and the EEX contracts provide a clear benchmark for the price of baseload electricity at any point in time. Their highly liquid futures contracts were a perfect match for S&P DJI when it came to creating benchmark indices for European power.

Power markets will play a crucial role in the green energy transition as the need to measure renewable power generation is becoming the main focus of many global corporations and governments. Germany is a great place to start as it is the largest power market in Europe, with volumes over 250 million MWh a month, more than 6x larger than the second biggest in Europe, France. In Germany, renewables’ share of gross power consumption is currently over 40% and is expected to rise to 80% by 2030.1 Most of renewables’ power comes from wind.

S&P DJI continues to be the index leader when it comes to bringing innovative, thematic, climate-focused offerings to market. The S&P GSCI European Power Indices are another example of how we look to drive transparency in new and exciting markets as they develop. To learn more, please visit our commodities investment theme page.


1 Source: BDEW Energy Supply 2021 – Annual Report

The posts on this blog are opinions, not advice. Please read our Disclaimers.

Oil, Gas, and ESG: S&P Europe 350 ESG Index Increased Sensitivity (or Lack Thereof)

Contributor Image
Ben Leale-Green

Former Associate Director, Research & Design, ESG Indices

S&P Dow Jones Indices

Commodities crushed it in 2021, with stretched supply chains a driving factor. The strong performance didn’t stop as we entered 2022. In this blog, we specifically look at crude oil and natural gas, which have outperformed the European equity market by some distance since the start of 2021 (see Exhibit 1), and what this can mean for European ESG strategies.

Given the environmentally unfriendly nature of these fossil fuel-based energy sources, it would make sense for an ESG strategy to have less exposure to energy companies. This expectation would assume an active sensitivity to both crude oil and natural gas, causing a drag on performance during times of rising oil and gas prices. Is this assumption true? Not necessarily. Since the index’s first value date, we observe no statistically significant correlation1 between the excess return of the S&P Europe 350 ESG Index (excess of its market cap-weighted benchmark) and either natural gas or crude oil (see Exhibit 2). Simply put, there has been no significant increase or decrease in exposure to natural gas or crude oil shown by the S&P Europe 350 ESG Index, relative to its market cap-weighted benchmark.

Why the lack of increased sensitivity? It’s all about index construction (see Exhibit 3). The S&P Europe 350 ESG Index targets sector neutrality (see Exhibit 4) by removing the companies with the lowest S&P DJI ESG Scores per GICS® industry group, after making exclusions based on undesirable ESG exposures. This means we are making exclusions on a relative basis within each industry group, rather than removing entire industry groups.

The end result? By employing S&P DJI ESG Scores and the most common ESG exclusions, the S&P Europe 350 ESG Index may fulfil the most important requirements for market participants seeking a broad, large-cap European ESG benchmark. By incorporating sustainability principles, the index could help align investments with principles while providing benchmark-like risk/return characteristics, while providing access to the broader, liquid European market. This culminates in the possibility of the S&P Europe 350 ESG Index serving as a common starting point for the growing market focused on sustainability.2

For a more in-depth look at this index, see The S&P Europe 350 ESG Index: Defining Europe’s Sustainable Core.


1 As measured by the p-values of the Pearson rank correlation.

2 The S&P Europe 350® ESG Index: A Broad, Sustainable Index Solution (Steadman, 2022). https://www.spglobal.com/spdji/en/documents/education/education-sp-europe-350-esg-index-a-broad-sustainable-index-solution.pdf

The posts on this blog are opinions, not advice. Please read our Disclaimers.