Get Indexology® Blog updates via email.

In This List

Tilting Toward Sustainability with the S&P/NZX 50 Portfolio ESG Tilted Index

Latin American Equities Post a Strong Second Quarter, as Economic Activity Starts to Bounce Back

How Liquid Alternatives Deliver Diversification

Global Islamic Indices Continued Advance in H1 2021, but Lagged Conventional Counterparts

Understanding the Basics of Sustainability Part 1: Time for a New Strategy?

Tilting Toward Sustainability with the S&P/NZX 50 Portfolio ESG Tilted Index

Contributor Image
Ryan Christianson

Former Associate Director, APAC Lead, ESG Indices

S&P Dow Jones Indices

As they begin their journey in environmental, social, and governance (ESG) investing, many market participants are realizing that there are multiple ways in which an index methodology can incorporate ESG characteristics. Some strategies will look to screen out particular industry groups or companies participating in various business activities, while other strategies will make relative adjustments based on ESG scores. With the exception of a few eligibility criteria that are rather standard with ESG indices, the new S&P/NZX 50 Portfolio ESG Tilted Index takes the latter approach and tilts the weight of companies by their S&P DJI ESG Scores.

Using the S&P/NZX 50 Portfolio Index as the underlying benchmark, the ESG tilted index allows the same diversification across New Zealand sectors, while giving more weight to high ESG performing companies.

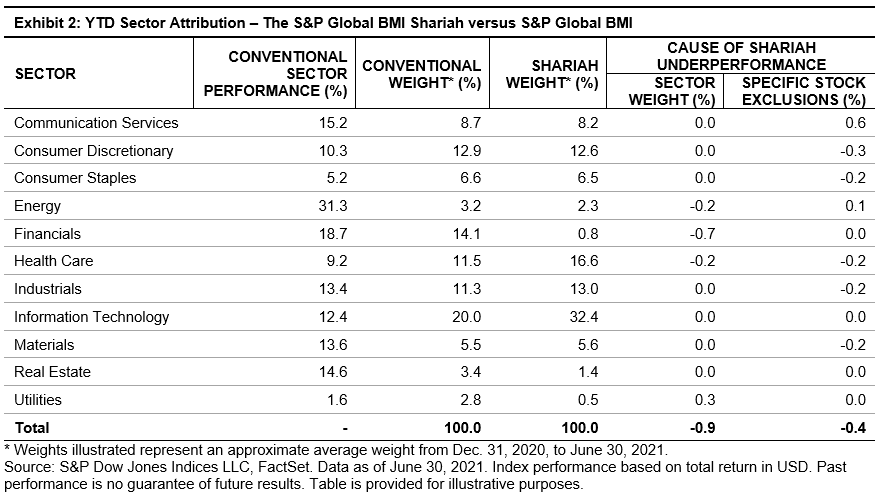
Though the history for the S&P/NZX 50 Portfolio ESG Tilted Index is limited due to availability of historical ESG data, since its inception date, the index’s performance has been stellar in comparison to its benchmark. The three- and five-year annualized returns outperformed the benchmark by 0.90% and 1.62%, respectively (see Exhibit 1).

S&P DJI ESG Scores are used as the primary dataset in evaluating the ESG performance of each constituent company. S&P DJI ESG Scores are the second set of ESG scores calculated by S&P Global ESG Research, in addition to the S&P Global ESG Scores that are used to define the Dow Jones Sustainability Indices constituents.

Each year, S&P Global conducts the Corporate Sustainability Assessment (CSA), in which analysts examine over 11,000 companies globally. The CSA has produced one of the world’s most comprehensive databases of financially material sustainability information.

Regarding index exclusions, there are several different business activities that deem a company ineligible for inclusion in the S&P/NZX 50 Portfolio ESG Tilted Index. These categories include controversial weapons, thermal coal, and tobacco. These are the same exclusions found in the S&P 500® ESG Tilted Index. In addition to the aforementioned business activities, in response to regulations and demand seen from the local New Zealand market, the methodology also excludes companies from the Energy sector as well as those that operate in the Casinos and Gaming sub-industry, as defined by GICS®.

Lastly, the index methodology also screens companies based on their accordance to the United Nations Global Compact (UNGC) Principles. This is done by utilizing Sustainalytics’ Global Standards Screening (GSS), which provides an assessment of a company’s impact on stakeholders and the extent to which a company causes, contributes, or is linked to violations of international norms and standards. Companies that are deemed “Non-Compliant” by Sustainalytics are ineligible for index inclusion.

As interest in and availability of ESG strategies are growing around the world, the same can be said for New Zealand. Market participants are making active decisions about the types of funds that they choose, and looking to ensure that those funds are aligned not only with their risk/return expectations, but that they also take material ESG matters into consideration.

There have been recent changes in New Zealand that have also been driving investor interest in ESG. For example, there has been increased attention to how responsible default providers for KiwiSaver (New Zealand pension funds) are with their investment portfolios. Another example is the Ministry of Business, Innovation & Employment applying rules around investments in companies with exposure to fossil fuel production and illegal weapons.

We are keeping an eye on these growing local and global trends to ensure that indexing strategies are in line with the expectations of not just investors, but also the policy makers that govern those respective markets.

The posts on this blog are opinions, not advice. Please read our Disclaimers.

Latin American Equities Post a Strong Second Quarter, as Economic Activity Starts to Bounce Back

Contributor Image
Silvia Kitchener

Director, Global Equity Indices, Latin America

S&P Dow Jones Indices

What a difference a year makes. Latin American equities had a strong Q2, outperforming most regions, as the S&P Latin America BMI gained 15.7%. As of June 2021, the index had its best 12-month return since June 2007, gaining 46.6%. More than a year after the COVID-19 pandemic wreaked havoc on the global economy and public health, the S&P Latin America 40 was one of the best regional performers, up 51% for the one-year period ending in June.

Thanks to the development of effective vaccines to combat the COVID-19 pandemic, global economic optimism is palpable. For Q2, the S&P 500® gained 8.5%, the S&P Europe 350® was up 7.7%, and the S&P Emerging BMI rose 7.5%. Despite the enthusiasm, emerging markets and Latin America particularly remain a concern given the slow pace of vaccine rollouts, allowing for potentially vaccine-resistant variants to undermine any gains made during this recovery period. In addition, the political and civil unrest recently seen in countries like Chile, Colombia, and Peru are a potential threat to the stability and growth of the domestic and regional economies.

Consequently, the countries that performed the best in Q2 were Argentina, Brazil, and Mexico. Meanwhile, the Andean countries all underperformed. The S&P MILA Andean 40, representing Chile, Colombia, and Peru, lost 10.6% in USD. Chile’s S&P IPSA and S&P/BVL Peru Select 20% Capped Index were the worst performers, down 11.6%, and 9.6%, respectively, in local currency, with the S&P Colombia Select Index declining 2.5% in local currency.

In terms of sectors, the S&P Latin America BMI’s Energy and Consumer Discretionary sectors topped the charts in Q2, gaining 31.5% and 25.3%, respectively. The only sector that did not generate positive return this quarter was Real Estate, which ended nearly flat, at -0.4%. Interesting to note, the Materials sector has been the most consistent outperformer over the short and long term. The sector includes some of the best-performing companies in the past 12 months like Mexico’s Cemex SA and Grupo Mexico, Brazil’s Vale S.A. and Gerdau S.A., Chile’s SOQUIMICH, and Peru’s Southern Copper.

With the increase of interest in sustainable investing, it is worth noting that the ESG indices for Brazil, Chile, and Mexico have performed well in comparison to their local benchmarks. While the primary objective of the ESG indices is to improve the S&P DJI ESG Score profile compared with the underlying index, sometimes the indices can do both: outperform and improve the ESG profile.

As more and more companies participate in the ESG evaluation process, and local regulations offer guidance for investment decisions to pension funds, it is going be an area of great development in the investment industry.

Overall, there are still many challenges for the region. At its core, a quicker path to overcoming the pandemic is needed, as well as a strong and stable economic recovery, not to mention stable political systems that support the development of capital markets. The good news is that each country is working hard to restore public health and economic stability. To that end, let’s hope the second half of the year will be as strong as the first.

The posts on this blog are opinions, not advice. Please read our Disclaimers.

How Liquid Alternatives Deliver Diversification

Examine the potential pros and cons of liquid alternatives and how index innovations may help insurers diversify and protect against risk with S&P DJI’s Rupert Watts and Kelsey Stokes.

Watch S&P DJI’s Annual Insurance Summit: https://www.spglobal.com/spdji/en/events/annual-insurance-investment-summit-how-are-insurers-staying-ahead-of-the-curve/#summary

The posts on this blog are opinions, not advice. Please read our Disclaimers.

Global Islamic Indices Continued Advance in H1 2021, but Lagged Conventional Counterparts

Contributor Image
John Welling

Director, Global Equity Indices

S&P Dow Jones Indices

Global equities continued to rise during the second quarter, gaining 7.2% as measured by the S&P Global BMI, raising the YTD tally to 12.8%. Shariah-compliant benchmarks, including the S&P Global BMI Shariah and Dow Jones Islamic Market (DJIM) World Index, somewhat underperformed their conventional counterparts YTD, in part due to continued strength in the Financials sector, which gained 18.7% during the period. All major regional Shariah and conventional benchmarks had positive returns YTD.

Sector Drivers Led to Underperformance of Shariah Benchmarks YTD

While global equities rallied broadly through H1 2021, sector performance played a part in the relative underperformance of Shariah-compliant equity benchmarks. Financials—which is nearly absent from Islamic indices—outperformed the broader market with a gain of 18.7%, contributing most heavily to the broad outperformance of conventional benchmarks over the period. While Energy represents a smaller portion of broad benchmarks, the sector outpaced the broader market by strides, gaining 31.3%, further adding to the conventional outperformance.

Exhibit 2 displays sector returns along with the effect of over- and under-weight sector allocations of the S&P Global BMI Shariah compared with its conventional counterpart. A large majority of S&P Global BMI Shariah underperformance during the period—0.9%—is explained by differing sector allocations, while 0.4% is explained by the inclusion or exclusion of individual Shariah-compliant stocks within sectors.

MENA Equities in Recovery

MENA regional equities gained considerably YTD, as the S&P Pan Arab Composite advanced 22.5%. The S&P Saudi Arabia BMI led the way in the region, gaining 30.7%, followed by the S&P United Arab Emirates BMI, up 25.8%.

Notably, the S&P Pan Arab Composite Shariah surpassed its conventional counterpart by 2.6% during the quarter, in large part due to significant representation of Saudi Arabia, which outshone its regional peers.

For more information on how Shariah-compliant benchmarks performed in Q2 2021, read our latest Shariah Scorecard.

This article was first published in IFN Volume 18 Issue 27 dated the 7th July 2021.

The posts on this blog are opinions, not advice. Please read our Disclaimers.

Understanding the Basics of Sustainability Part 1: Time for a New Strategy?

Contributor Image
Koel Ghosh

Former Head of South Asia

S&P Dow Jones Indices

The growing importance and inclusion of sustainability values among global investment themes has redefined investors’ views of sustainability factors in portfolio strategies. The idea that sustainability concepts are futuristic is dated—the future has definitely arrived.

The world is changing, and the percentage of retail and institutional investors applying environmental, social, and governance (ESG) principles is on the rise. More and more sustainability data providers are scaling their business to provide deeper qualitative and extensive information, as companies are prioritizing disclosure and reporting. Sustainable funds attracted USD 185.3 billion in net flows in the first quarter of 2021, which was up 17% from the previous quarter at USD 158.3 billion.1 While Europe led the ESG scoreboard followed by the U.S., Asia ex-Japan reported USD 7.8 billion, with 4% of total inflows and 237 funds. Many projections forecast a multifold growth in ESG solutions in investment products, so it might be time to take notice of this new wave.

India is slowly waking up to the growing reality of ESG relevance. While some have embraced this concept, skepticism rules in a market that has the leading country benchmark, the S&P BSE SENSEX, above 52,000 and a one-year annual return of 62%.2 The thought that ESG is just a novelty is still at large. Therefore, a deep dive into this fast-developing concept may be a worthwhile dialogue.

First, what are ESG values and what constitutes them? ESG investing is not about categorizing companies on the basis of how “good” they are but how they manage each of the ESG factors (environmental, social, and corporate governance), thereby helping investment strategies in their selection methodologies. S&P Dow Jones Indices has a wide gamut of indices tracking these factors. ESG indices based on core benchmarks, such as the S&P 500® ESG Index, S&P Europe 350® ESG Index, S&P 500 ESG Elite Index, and S&P BSE 100 ESG Index are just a few.

Exhibit 1 shows that return trends by ESG indices in U.S., Europe, and India tended to be higher than the underlying benchmark. Though nominal outperformance, it does contest many myths that ESG factors lead to underperformance. For the U.S. market, we compared the S&P 500 ESG Elite Index and S&P 500 ESG Index, both of which showed outperformance in the majority of periods, other than a slight underperformance by the S&P 500 ESG Index in the one-year period. The Indian benchmark outperformed the other benchmarks, but the ESG index still outperformed in all periods and by a greater margin than in the U.S. or Europe.

Though these statistics are not a forecast of future performance, it does provide a compelling review of such sustainability factors in investment strategies.

1 https://www.fundssociety.com/en/news/markets/global-assets-in-esg-funds-neared-2-trillion-dollars-boosted-by-record-inflows

2 Yearly annualized returns as of May 31, 2021

The posts on this blog are opinions, not advice. Please read our Disclaimers.