Get Indexology® Blog updates via email.

In This List

S&P GSCI Enjoys Strong First Half Performance

Making Innovation Accessible

Spotting Disruptive Technology in Sectors and Industries

U.K. Small Caps: Mind the Gap!

Why Disruptive Innovation Matters to Advisors

S&P GSCI Enjoys Strong First Half Performance

Contributor Image
Fiona Boal

Managing Director, Global Head of Equities

S&P Dow Jones Indices

The S&P GSCI rose 31.4% in the first half of 2021, outperforming the S&P 500®, which rose 15.2%. The S&P GSCI has more than doubled since hitting an all-time low during the initial stages of the COVID-19 pandemic in April 2020. Several commodities have reached new all-time highs this year, as the global economy has reflated, consumer confidence hit pre-pandemic highs in many regions, and supply chains remained disrupted. Aggressive fiscal and monetary support has also buoyed the recovery in industrial commodities prices. But it may not be plain sailing for commodities over the following months; recent flattening of the yield curve in the U.S. and elsewhere would suggest that, at least for now, the inflation trade that has been supporting commodities has lost some of its appeal.

The S&P GSCI Petroleum rallied an impressive 49.0% over the first six months of 2021. While uncertainty over the course of the COVID-19 pandemic may temporarily limit the final push to normalize demand, there is no doubt that a robust recovery in many major markets combined with impressive supply discipline have justified the recovery in prices. Market participants will be watching the disagreements within the OPEC+ alliance closely, given that any longer-term deadlock could signal the beginning of the end for the broader supply agreement and increase the risk that members independently turn on the taps.

Following a sprint higher over the first few months of the year, prices for industrial metals have cooled marginally in the wake of attempts by Chinese regulators to dampen speculation in its domestic commodities markets and signs that the U.S. Federal Reserve is concerned about inflation. Following year-long rallies across the industrial commodities markets, the suggestion that U.S. interest rates may be hiked sooner than expected and Beijing’s plans to release strategic metal reserves were a double whammy to metal’s reflation story in June. Nevertheless, the S&P GSCI Industrial Metals ended June up 19.5% YTD.

Precious metals, particularly gold, was the clear loser in the commodities complex in the first half of the year. By the end of June, the S&P GSCI Gold had fallen 7.0% YTD, after the U.S. Federal Reserve sped up its expected pace of policy tightening, which led many market participants to reconsider the so-called inflation trade. The rise in U.S. stocks to a fresh record and a resurgent U.S. dollar also weighed on the yellow metal.

The S&P GSCI Agriculture finished the month flat but rallied 19.1% YTD. Apart from cocoa, all constituents of the S&P GSCI Agriculture subindex ended the first half in positive territory, but the clear winner was corn, with the S&P GSCI Corn up 38.9% YTD. The multi-month rally in corn prices followed an abrupt tightening of global corn supplies, including the announcement by the USDA on the last day of June that U.S. farmers had planted less acres of corn than expected.

The S&P GSCI Livestock rallied 7.5% over the first six months of the year. Some of the luster came off lean hogs in June, with the S&P GSCI Lean Hogs falling 11.3% in the wake of China’s announcement that the country’s hog herd was rebuilding faster than expected from African swine fever.

The posts on this blog are opinions, not advice. Please read our Disclaimers.

Making Innovation Accessible

Explore strategies and practices for identifying, selecting, and delivering innovation and disruptive technologies with Main Management’s Kim D. Arthur, IDX’s Ben McMillan, Kensington Asset Management’s Bruce P. DeLaurentis, and 3D/L Capital Management’s Benjamin M. Lavine.

Watch the full event

https://on.spdji.com/harnessing-disruptive-innovation-with-indices-event-2021

The posts on this blog are opinions, not advice. Please read our Disclaimers.

Spotting Disruptive Technology in Sectors and Industries

John van Moyland, Global Head of S&P Kensho Indices at S&P DJI, joins Matthew Bartolini of State Street Global Advisors to examine how a new generation of indices, powered by AI and designed to track exponential innovation systematically, is helping advisors access the companies driving the Fourth Industrial Revolution.


The posts on this blog are opinions, not advice. Please read our Disclaimers.

U.K. Small Caps: Mind the Gap!

Contributor Image
Sherifa Issifu

Senior Analyst, U.S. Equity Indices

S&P Dow Jones Indices

A gap between the 12-month performances of the S&P United Kingdom SmallCap and S&P United Kingdom SmallCap Select Index hints at a “junk rally” in U.K. stocks, but the longer-term data suggests that those looking to participate in an ongoing recovery in the world’s fourth-largest economy might be wise to maintain a selective approach.

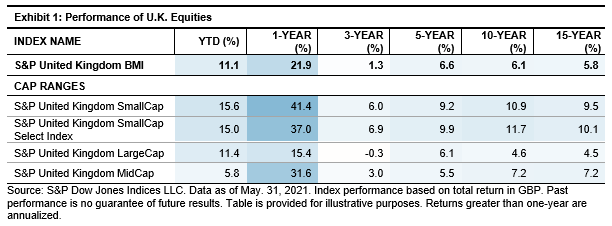
As the global recovery from the coronavirus pandemic continues, the U.K. economy has picked up a head of steam, with the Bank of England forecasting over 4% GDP growth in Q2 alone. The pound sterling has surged to a near three-year high versus the U.S. dollar and, although the local equity markets aren’t quite back to pre-pandemic levels, they appear to be on the right track, with the S&P United Kingdom BMI adding 11% so far in 2021. Carrying a natural domestic focus and higher gearing to the economy, small-cap companies are benefiting the most from the optimism and the British “recovery trade,” outperforming the broad market index by five percentage points YTD.

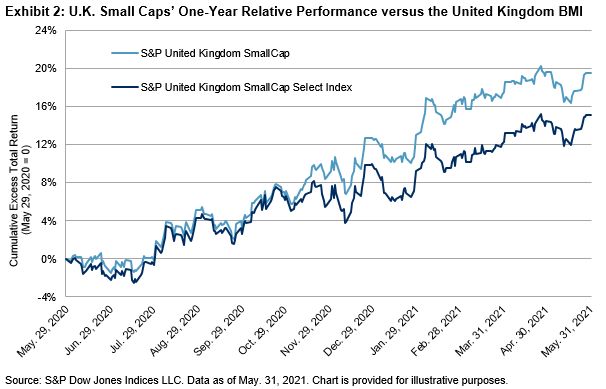
However, within small-cap U.K. equities, there has also been something of a junk rally, with the outperformance of lower-quality stocks creating a more than 5% performance gap over the past year between the S&P United Kingdom SmallCap and the S&P United Kingdom SmallCap Select Index, the latter of which is designed to measure constituents of the S&P United Kingdom SmallCap with a track record of positive earnings. This echoes a recent inverse relationship between profitability and performance on the other side of the pond that we highlighted in May’s S&P 500 Factor Dashboard.

So, is there still a benefit to be gained by screening out the lower-quality names from small caps? As a recap for those who might not have met our “select” range of global small-cap indices, they are formed from their respective small-cap universes (in this case, the smallest 15% of companies by capitalization in the broad-based S&P United Kingdom BMI) by requiring two consecutive years of positive earnings per share at the point of index entry. Companies are also dropped if they post two consecutive years of negative earnings, while, to aid market participants hoping to replicate the index’s return, the smallest 20% and least liquid 20% of companies are excluded.

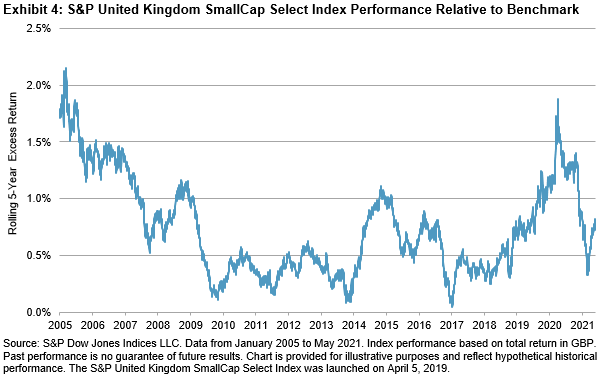
The potential benefits of the “select” methodology are illustrated in Exhibit 4, which plots the difference in five-year annualized returns between the S&P United Kingdom SmallCap and S&P United Kingdom SmallCap Select Index over the past 15 years. The S&P United Kingdom SmallCap Select Index outperformed across every rolling five-year interval including, despite the recent rally in unprofitable companies, the period ending in May 2021. Further, the winds may have changed, with the series appearing to take on an upward trend early in 2021.

The booming prospects for the world’s fourth-largest equity market may be tempting market participants to return to U.K. equities after a long period in the doldrums, and smaller U.K. companies may be well positioned to participate in growth. But it is worth emphasizing that while unprofitable companies may be currently in the lead this year, filtering out less profitable firms has, over the long term, made a big and positive difference in small caps.

The posts on this blog are opinions, not advice. Please read our Disclaimers.

Why Disruptive Innovation Matters to Advisors

Ric Edelman, Founder of RIA Digital Assets Council, explores the new economy, its potential sources of growth, and the importance of “future proofing” client strategies.

The posts on this blog are opinions, not advice. Please read our Disclaimers.