Get Indexology® Blog updates via email.

In This List

Reflecting on the Inflection Points of 2020

A Global Macro Look Back at Commodities in 2020

Persistence

Decrement Indices Explained

Tesla: Not an Automatic Addition to the S&P 500 ESG Index

Reflecting on the Inflection Points of 2020

Contributor Image
Jim Wiederhold

Former Director, Commodities and Real Assets

S&P Dow Jones Indices

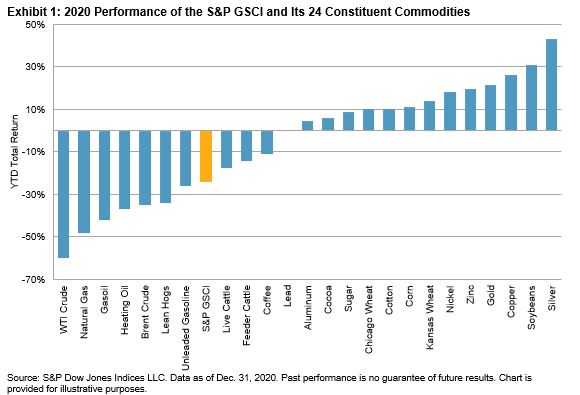
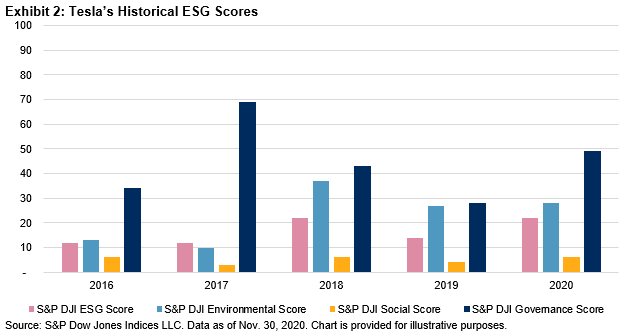
Last year might end up being known as the year of countless inflection points. Narratives that were playing out over months and years were accelerated or reversed with volatility not seen since World War II. Among commodities, there were new all-time highs hit in gold and new all-time lows that reached into negative territory for crude oil. Exhibit 1 shows that while the S&P GSCI dropped 24% for the year, three sectors finished positive and a monstrous 69.24% separated the best-performing S&P GSCI Precious Metals from the worst performing S&P GSCI Energy.

One of the most monumental narratives of 2020 involved the April dip into negative territory for WTI Crude Oil front month futures. Fiona Boal explained what happened during this extreme time in commodities history and how Crude Oil Can Get Carried Away by Contango. Inflows into ETFs tracking crude oil exploded, with many market participants trying to buy the dip. Economies have slowly reopened since, but energy usage is still below 2019 levels. The one bright spot within energy was the S&P GSCI Unleaded Gasoline, which rose 12.82% in December. Holiday travel demand picked up in the Western Hemisphere while demand overall for autos remained strong, as they are seen as one of the safest ways to travel during a pandemic. The S&P GSCI Natural Gas dropped 12.56% in December as warm winter forecasts reduced the need to stock up for building heating needs.

The S&P GSCI Agriculture and S&P GSCI Livestock took two very different paths in 2020. The former rose 14.94% while the latter fell 22.10%. As these have been somewhat correlated historically due to the use of grains as feed for livestock and geographically being grown in some of the same areas, 2020 was an inflection point. Except for coffee, every S&P GSCI Agriculture constituent rose, most by double digits. The most fundamental reason for bullishness was the surprise shortfall in grain stocks, which pushed some grains to multi-year highs. Following years of oversupply, the increasingly unpredictable weather patterns and the return of purchases from large consumer nations such as China represented an inflection point for agricultural commodities in 2020.  The 2020 Atlantic hurricane season had the most hurricanes on record, with 30 named storms, over two and a half times more than the average. While many meat producers were hit hard with COVID-19 outbreaks in their plants reducing supply, the hog herd in China returned with gusto after 2019’s African Swine Fever outbreak. The supply in China more than offset any reduction in the U.S. On the demand side, U.S. restaurant dining picked up during Q3 2020, but fell again to June levels by the end of Q4.

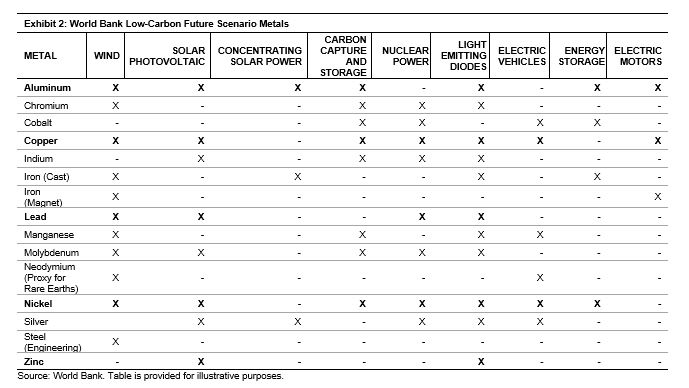
Green technologies were building momentum for years, but 2020 might be the inflection point where they truly took off. Besides rare earth metals, the building blocks for many of these technologies come from the S&P GSCI Industrial Metals and S&P GSCI Precious Metals. All five constituents of the S&P GSCI Industrial Metals are used in low-carbon technologies, with aluminum, nickel, and copper used the most. Within the precious metals space, silver is used extensively in solar photovoltaics, LEDs, and electric vehicles. Exhibit 2 shows metal use in select low-carbon technologies.

Any of the S&P GSCI Single Commodities Indices could be used to implement tactical views on the direction of a single commodity. S&P Dow Jones Indices calculates hundreds of indices based on commodities around the world in real time. Check out our website for more information.

The posts on this blog are opinions, not advice. Please read our Disclaimers.

A Global Macro Look Back at Commodities in 2020

Contributor Image
Jim Wiederhold

Former Director, Commodities and Real Assets

S&P Dow Jones Indices

Over the past 50 years, commodities have displayed mostly positive yearly performances, as measured by the world-production-weighted S&P GSCI. The index rose in 34 out of those 50 years, or roughly 70% of the time. Usage as an inflation hedge coupled with its low correlation to other asset classes has given market participants ample reasons to fit commodities into investment portfolios. However, the past decade has been an exception. Commodities only rose four times during the 2010s, making it the worst decade for the asset class, with an annualized 10-year return of -8.65% for the S&P GSCI. In 2020, the S&P GSCI fell 24%, pulled down by the worst-performing energy commodities, as shown in Exhibit 1. Energy commodities make up over 60% of the index. The underperformance of livestock also negatively contributed, but not to the same degree.

While other asset classes like equities and credit were able to jump back up quickly to their multi-year trends after the lows in March 2020, many commodities could not claw back out of negative territory. This points to the unique property of commodities as a spot or real-time asset. Equities are a more anticipatory asset, looking ahead to the environment months or years into the future. Commodities tend to represent the current environment at a specific moment in time, represented by the nearby front-month futures contracts that make up the S&P GSCI. The current environment and outlook for commodities is uncertain; with increased concern about inflation, but no solid signs yet, we exited the recent disinflationary environment.

Historically, commodities have tended to do well during times of high inflation, as shown in Exhibit 3. We may be entering such an environment. Massive amounts of fiscal and monetary stimulus could lead to inflation. An outsized global economic recovery could inflate prices if demand explodes but production struggles to keep up. Higher costs to produce goods and rising wages could also be factors of inflation. After years without concern over inflation, market participants started adding inflation hedges to their portfolios in 2020.

The S&P GSCI seeks to offer market participants the chance to hedge against inflation, diversify a portfolio, or take a directional approach to the broad commodities market.

The posts on this blog are opinions, not advice. Please read our Disclaimers.

Persistence

Contributor Image
Craig Lazzara

Former Managing Director, Index Investment Strategy

S&P Dow Jones Indices

Lyndon Baines Johnson became President of the United States at a moment of national trauma, and left office at a time of tremendous political division. Despite a landslide electoral victory in 1964 and notable legislative achievements, his was not a happy presidency. LBJ observed, in fact, that “being President is like being a jackass in a hailstorm. There’s nothing to do but to stand there and take it.”

Regardless of whether it’s true of the presidency, Johnson’s analogy was clearly applicable to equity investors in 2020. Consider the vicissitudes of the S&P 500®:

  • The year got off to a good start, as the market rose by 5.1% until peaking on February 19.
  • Then began one of the most precipitous declines in market history. The S&P 500 fell by -33.8% between February 19 and March 23. (In the global financial crisis of 2007-09, the comparable decline required a full year.) When the market closed on March 23, the S&P 500’s year-to-date total return stood at -30.4%.
  • In an extraordinary rebound, the S&P 500 rallied by 61.4% between March 23 and September 2.
  • This was followed by a -9.5% decline until September 23, a 9.3% gain through October 12, and a -7.4% decline through October 30.
  • The year ended with a gain of 15.2% in November and December.

Between March 23 and year-end, in other words, the S&P 500 rose 70%. What did an investor have to do to benefit from this remarkable turnabout in the equity market?

Nothing. We’ve argued before that sometimes successful portfolio management requires holding positions when one’s natural instinct is to sell, and 2020 provided an emphatic demonstration of that principle.

Although last year’s recovery was unusually large, Exhibit 1 shows that it was by no means unique. Over the last 30 years, the annual total return of the S&P 500 has averaged 12.2%. But it’s rare for the market to rise without a pause; in 27 of those 30 years, at some point during the year the S&P 500 has had a negative total return. Across all 30 years, the total return at the year’s low point was -9.1%. The average recovery from the annual low has been 23.8%.

Even in extreme declines, standing firm can pay off. There have been ten years (including 2020) when the S&P 500’s peak-to-trough decline exceeded 15%; in half of them, the market finished in positive territory. A year later, the gain from the bottom averaged 38%.

Market history tells us that selling can be most damaging precisely when it’s most tempting. The key to success in 2020 was resisting the urge to panic when panic seemed like the most reasonable path. Like Johnson’s proverbial jackass, the only requirement was “to stand there and take it.” Investors who tolerated the downdrafts were well-rewarded by year end.

The posts on this blog are opinions, not advice. Please read our Disclaimers.

Decrement Indices Explained

Contributor Image
Izzy Wang

Senior Analyst, Factors and Dividends

S&P Dow Jones Indices

Decrement indices have gained popularity as the underlying assets of equity-linked structured products in Europe and Asia. According to SRP, among the 318 products across asset classes in France that matured or autocalled between April 2018 and March 2019, more than 32 were linked to decrement indices.1

One of the reasons behind this recent popularity is today’s low interest rate environment, which makes it challenging for structured product issuers to design attractive products. This triggered a search for a new underlying asset that could deliver cheaper optionality. Decrement indices were designed for this purpose. By eliminating dividend risk, issuers could provide more favorable terms at the structural level, such as higher participation rates and improved capital protection.

It is important to understand that the gain on favorable product terms does not come without cost. Exhibit 1 illustrates some of the tradeoffs for structured products linked to decrement indices compared with conventional indices. To understand the risk for the underlying index, it is worthwhile to look at the construction of decrement indices.

How Do Decrement Indices Work?

A decrement is an overlay applied to equity indices. A decrement index is constructed by deducting a predefined dividend (also known as a synthetic dividend) from a total return index on a daily basis. As total return can also be broken down into price return and realized dividends,2 a parity relation exists between price return and decrement index return with dividends added (see Exhibit 2).

Depending on whether the fixed synthetic dividend (refer to RHS in Exhibit 2) is greater or less than the actual realized dividends received (refer to LHS in Exhibit 2), the decrement index could underperform or outperform the corresponding price return index. To deliver returns similar to those of the price return index, the predefined dividend markdown should be roughly the same as the realized dividends. If the predefined dividend markdown is significantly larger than the average realized dividends, a decrement index could persistently underperform its price return version.

When the market is stable or steadily increasing, decrement indices tend to be more beneficial to investors compared with the price return index. In adverse market conditions, however, it is important to acknowledge that decrement indices may represent a large reduction in returns.

For example, during COVID-19 sell-off, the S&P 500® price return index dropped by 34% from Feb. 9, 2020, to March 23, 2020. For a 20-point decrement index starting from an initial index level of 1000, a 34% drop in the index level meant an increase in the return deduction from 2% to 2.6%.

Fixed Percentage Deduction versus Fixed Point Deduction

Decrement indices use two major methods to deduct the predefined dividends: fixed percentage or fixed points. On a daily basis, the former deducts a fixed percentage of the returns while the latter subtracts fixed index points from the index level.

The logic of using the fixed percentage method is that dividend yield tends to be stable over the long term. During the past 10 years, the trailing 12-month dividend yield for the S&P 500 was relatively stable, around 2%. Therefore, dividend markdowns for fixed percentage decrement indices are often in line with historical long-term dividend yield averages.

On the other hand, a fixed points deduction captures the consistency in dividend amounts in the short term, as companies are inclined to maintain more stable dividend policies compared to their earnings. For fixed points decrements, the effective percentage deduction on the index base date, which is calculated by fixed points divided by initial index level, is usually set to be consistent with the recent realized dividend yield.

These two methods are often close when the market is stable but could display significant differences in the movement of the underlying index level. Specifically, the percentage deduction from total return is constant for fixed percentage decrement indices; and variable for fixed point decrement indices, depending on the market movement direction (see Exhibit 3).

Key Takeaway

The decrement strategy is an index innovation that aims to solve specific challenges presented by structured products—–a low interest rate environment and the need to hedge dividend risk. Despite the simple construction, there are nuances that market participants may want to better understand, such as potential underperformance when deduction is too high and varying deduction methods. For more information on the S&P Decrement Indices, please refer to the “Fee Indices/Decrement Indices” section of the Index Mathematics Methodology document, as well as the S&P Dow Jones Decrement Indices Parameters.

1 SRP, Structured Products Performance Review, France, April 2018 to March 2019. Retrieved from https://afpdb.org/wp-content/uploads/2019/12/France-Performance-Report.pdf.

2 Including dividends reinvestment.

The posts on this blog are opinions, not advice. Please read our Disclaimers.

Tesla: Not an Automatic Addition to the S&P 500 ESG Index

Contributor Image
Daniel Perrone

Former Director and Head of Operations, ESG Indices

S&P Dow Jones Indices

Since S&P Dow Jones Indices announced that Tesla would be added to the S&P 500® on Dec. 21, 2020, many investors have contacted us asking when this transformative company will become a member of the S&P 500 ESG Index, the sustainable counterpart to the S&P 500. The answer, in brief, is that Tesla will not automatically join the S&P 500 ESG Index upon its addition to the S&P 500. Instead, Tesla will be assessed during the next annual rebalance of the S&P 500 ESG Index, taking place at the end of April 2021. But even then, inclusion into the index is not assured. Whether Tesla becomes an index constituent will be determined by its sustainability performance across many criteria relative to its peers.

Tesla’s ESG Score

The main driver of whether a company is selected to join the S&P 500 ESG Index is its S&P DJI ESG Score. This score is derived from the annual Corporate Sustainability Assessment (CSA), which is administered by SAM, a part of S&P Global. The CSA is a highly granular, industry-specific questionnaire based on financial material ESG metrics. Insights gathered from the CSA form the backbone of the ESG score that is used to select companies added to the S&P 500 ESG Index.

For this current assessment year, Tesla’s S&P DJI ESG Score was 22 out of 100, up 8 points from 2019’s score. This is driven by its ESG Dimension Scores, including an Environmental score of 28 (up 1 point from last year), a Social score of 6 (up 2 points), and a Governance score of 49 (up 21 points). Tesla does not fill out the CSA, so its S&P DJI ESG Score is determined based on research using publicly available information.

Many may be surprised to see such a low overall ESG score (and Environmental score) for Tesla, given its focus on electric vehicles. Specializing in “green” products, however, does not automatically ensure that companies will score well from an overall ESG perspective. The S&P DJI ESG Score is wide ranging in what it encompasses, as it is meant to capture a company’s broad sustainability performance.

In the Environmental dimension, Tesla of course scored well in the area of low carbon strategy, with a nearly perfect score of 99. However, the company scored low in environmental reporting, climate strategy, and environmental policy and management systems, which suppressed the company’s overall Environmental score.1 Tesla also scored especially low on social metrics across the board, which include human capital development, social reporting, and labor practice indicators. Tesla did comparatively well in the Governance realm, especially relative to the prior year.2

The S&P 500 ESG Index Methodology

So, what does this mean for Tesla’s standing in the S&P 500 ESG Index? We won’t know until the upcoming annual rebalance is finalized on the last business day of April 2021. At that time, Tesla will be measured against its peers across many ESG criteria. As mentioned earlier, however, the biggest determinant of the composition of the S&P 500 ESG Index is a company’s S&P DJI ESG Score. But it’s not just a company’s absolute performance that matters; a company also needs to rate well relative to its peers.

The S&P DJI ESG Score is used in two ways in the index methodology. First, the bottom 25% of companies in each GICS® industry group is screened out on a global basis. This prevents a company that is a good ESG performer locally but poor on a global basis from making it into the index. Second, companies are ranked by their ESG score within the S&P 500 and then selected from the top down to get as close as possible to 75% of the industry group’s original market capitalization.

Will Tesla make it through these two key screens and become a member of the S&P 500 ESG Index? Next April, we’ll know. The S&P 500 ESG Index has no early-entry rule that would afford Tesla extra privileges; it will be treated the same as any other company.


The author would like to thank Reid Steadman for his extensive contributions to this blog post.


1 According to the CSA, low carbon strategy (which is a unique criterion to the automobiles industry) is defined as an assessment of strategies implemented by companies to reduce the carbon intensity of their core portfolio, while climate strategy is defined as an assessment of strategies put in place by companies to address the scale of the challenge climate change represents for their industry, and environmental policy and management systems covers management tools implemented by companies in order to improve their environmental performance in a cost-effective way and reduce the risk of incurring fines or penalties for not complying with environmental legislation.

2 To provide some context for Tesla’s scores, the S&P DJI ESG Scores are normalized across global industries and are designed to be read as percentiles. Thus, a score of 22 means that that company had a higher score than 22% of its industry peers globally.

The posts on this blog are opinions, not advice. Please read our Disclaimers.