Get Indexology® Blog updates via email.

In This List

SPIVA® Latin America Mid-Year 2020 Scorecard: Convergence to Underperformance

ESG – All the Rage!

Tesla Added to the S&P 500

Where Do You See Yourself in Five Years? China Stocks Up ahead of Their Latest Five-Year Plan

Motions of the Market

SPIVA® Latin America Mid-Year 2020 Scorecard: Convergence to Underperformance

Contributor Image
Maria Sanchez

Director, Sustainability Index Product Management, U.S. Equity Indices

S&P Dow Jones Indices

We recently published our industry-famous SPIVA report for the Latin America region. SPIVA, which stands for S&P Indices Versus Active, analyzes the performance of actively managed mutual funds against their respective category benchmark. In the case of Latin America, S&P Dow Jones Indices began publishing the scorecard in 2014, covering Brazil, Chile, and Mexico.

The SPIVA Latin America Mid-Year 2020 Scorecard shows that the majority of active equity managers in Chile and Mexico failed to outperform their benchmarks over 1-, 3-, 5-, and 10-year periods, even when the first half of 2020 offered abundant opportunities for active managers. The dispersion and volatility of the S&P Latin America BMI’s constituents remained above the historical median for four of the six months.1

However, Brazilian active managers in the Brazil Equity Funds, Brazil Large-Cap Funds, and Brazil Corporate Bond Funds categories managed to take advantage of the circumstances in the short term. We have seen this outperformance by active managers on a short-term basis in the past as well.

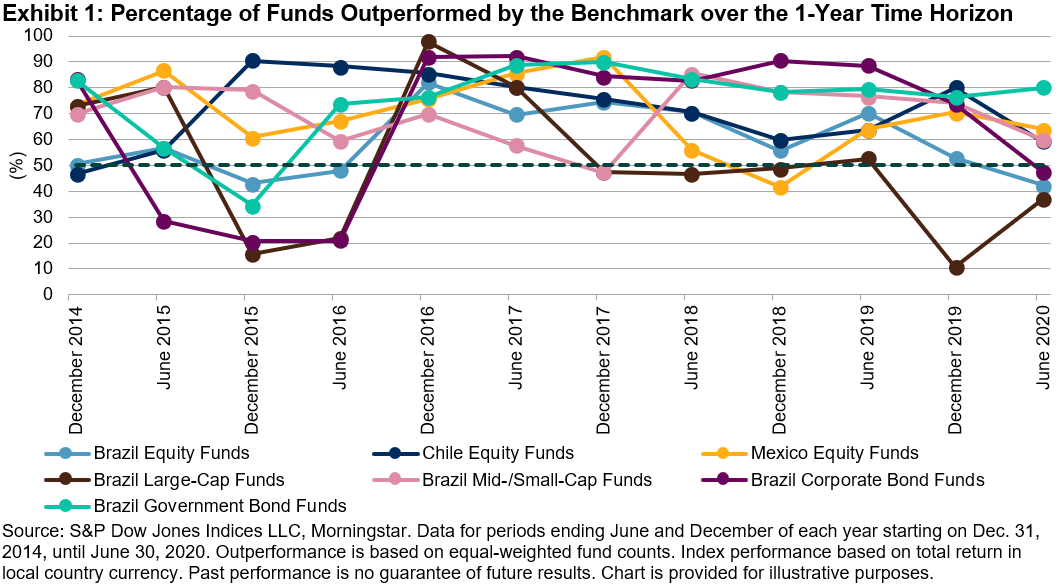
A compilation of the Latin America SPIVA scorecards from year-end 2014 to mid-year 2020 show that when observing one-year periods, Chilean active managers outperformed in December 2014; Brazilian active managers outperformed in one or more of their categories in June 2015, December 2015, and June 2016; and the majority of Mexican equity active managers were able to beat their benchmarks in December 2019 (see Exhibit 1).

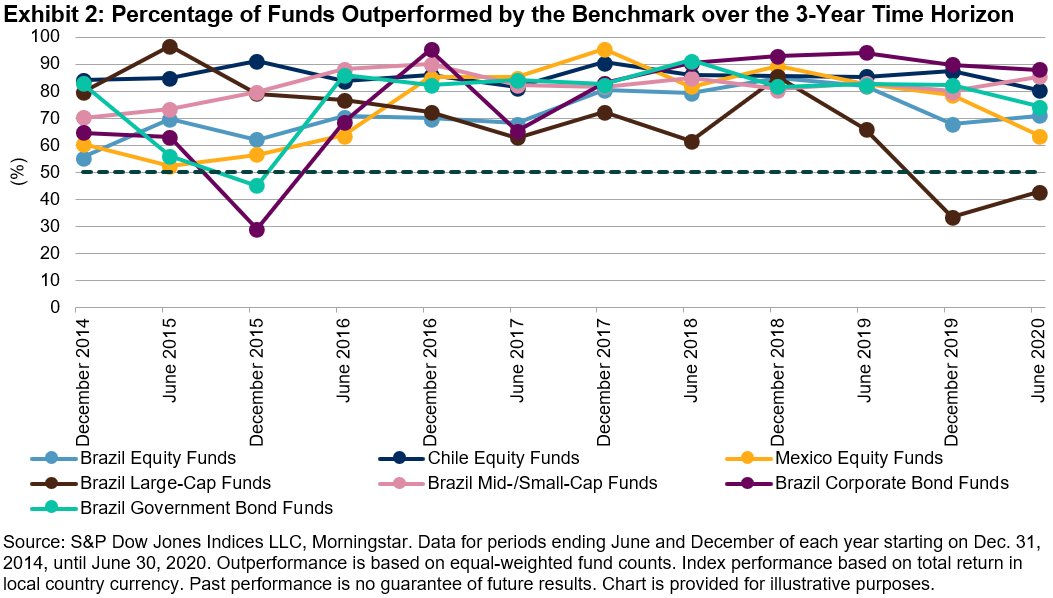
However, when compared with a longer time horizon, say a three-year period, we see that the percentage of active managers outperforming goes down.

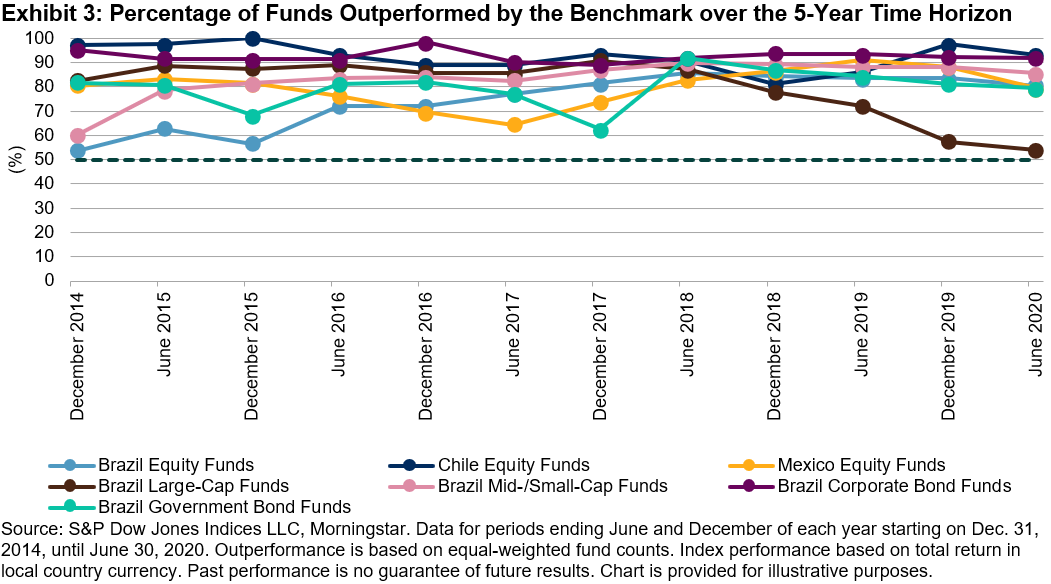
And when considering even longer time periods, like across a five-year period, the majority of active managers in all categories for all three countries were outperformed by their benchmarks.

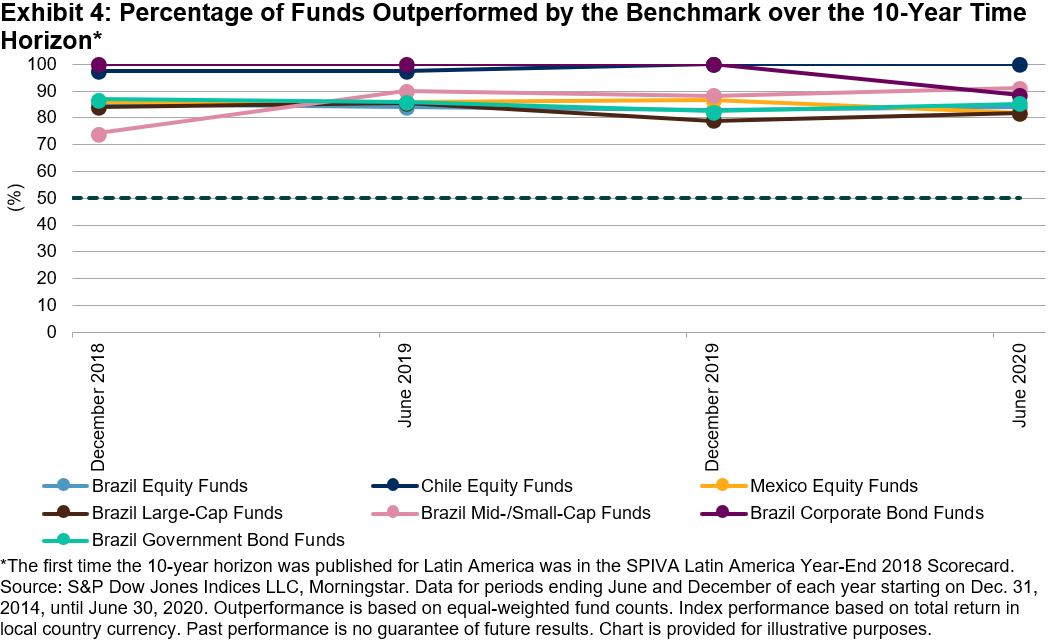
Lastly, for the 10-year period observed, the percentage of funds outperformed by their benchmarks converged in a range above 70%.

As evidenced by the SPIVA scorecards, the majority of active managers underperform most of the time, especially across long-term horizons, demonstrating how difficult is to consistently beat the benchmark.

1 Index Dashboard: Dispersion, Volatility & Correlation: January 2020; February 2020; March 2020; April 2020; May 2020; June 2020.

The posts on this blog are opinions, not advice. Please read our Disclaimers.

ESG – All the Rage!

Contributor Image
Stuart Magrath

Former Senior Director, Channel Management, Australia and New Zealand

S&P Dow Jones Indices

It appears that environmental, social, and governance (ESG) investing is “all the rage”—not only in the Asia Pacific region but all around the world. At S&P DJI, we have spent a lot of time and effort thinking through how best to construct indices that consider ESG values. One of our more recent innovations has been to launch ESG versions of our headline indices. One such headline index is the S&P/ASX 200, for which we now have an ESG version, the S&P/ASX 200 ESG Index.

By way of a quick summary, the S&P/ASX 200 ESG Index uses the same universe of constituents as the benchmark S&P/ASX 200, and then we apply a three-step process of screening, sorting, and selecting companies to make up the S&P/ASX 200 ESG.

  • The screening process removes any companies involved in the production or sale of tobacco, controversial weapons, and thermal coal, as well as those ranked among the lowest 5% of UN Global Compact scores. We also remove companies with an S&P DJI ESG Score that is in the bottom 25% of scores within their GICS® industry group globally.
  • We then sort the stocks from best to worst, according to their S&P DJI ESG Score within each GICS industry group.
  • Finally, we select stocks “top down” in each GICS industry group seeking to capture, as close as possible, 75% of the market capitalization. We repeat this process for each industry group.

Currently the S&P/ASX 200 ESG Index has 119 constituents, having removed 81 through the screen, sort, and select process.

In late September 2020, S&P DJI hosted a webinar with State Street Global Advisors, the Australian Securities Exchange (ASX), and a local financial adviser. We explored how the S&P/ASX 200 ESG Index was designed to be core to investors’ portfolios, and that the methodology adopted is not “puritanical,” but rather seeks to achieve a broadly similar risk/return profile to that of its benchmark, while providing investors with an index that also removes the worst-performing companies from an ESG perspective. In this way, market participants can be assured that they are not increasing risk, or foregoing returns, while also investing in a way that aligns with their values.

Tim Mackay, director and owner of Quantum Financial, provided some valuable insights from a practitioner’s perspective. Tim shared how the path he has trodden has led him to a point where he is advising clients to have ESG investing solutions at the core of clients’ portfolios. From a position of initial skepticism, where clients were not prepared to give up returns for a “feel good” investment, and where there were difficult trade-offs between the “E,” “S,” and “G” components (e.g., airlines pollute but employ lots of people, whereas clean industries don’t employ as many people), fee compression was the catalyst for taking a second look at sustainable investment solutions.

Tim also suggested that the uptake of ESG investing solutions has been turbo-charged by the COVID-19 pandemic, and after last summer’s bushfire in Australia, producing a slew of new investment products that are hitting the market in short order. While advisers may initially use these products as “satellite” investments, solutions that can sit at the core of a client’s portfolio are also emerging; exchange-traded products such as those that track the S&P/ASX 200 ESG Index can provide a diversified, transparent, flexible, and cost-efficient way to incorporate ESG into core investments.

The “ESG Goes Mainstream in the Wake of 2020 Upheavals” complimentary webinar replay is available on demand.

The posts on this blog are opinions, not advice. Please read our Disclaimers.

Tesla Added to the S&P 500

Contributor Image
Hamish Preston

Head of U.S. Equities

S&P Dow Jones Indices

Yesterday, S&P Dow Jones Indices announced that Tesla will be added to the S&P 500® prior to the open on Monday, Dec. 21, 2020. The Index Committee has not yet determined which current constituent Tesla will replace, nor how Tesla will be added to the index—because of its size, S&P DJI is seeking feedback through a consultation to answer the latter question. Still, the announcement highlights the importance of understanding the impact of index construction and index implementation.

Here is a brief overview of the S&P U.S. Indices Methodology document, some information to contextualize Tesla’s addition, and what impact it may have on the market.

S&P 500 – Not Simply the Largest 500 U.S.-Domiciled Companies

The S&P 500 is widely regarded as the best single gauge of large-cap U.S. equities, with more than USD 11.2 trillion indexed or benchmarked to the index as of December 2019. But while it is synonymous with U.S. equity market performance, the S&P 500 does not necessarily comprise the largest 500 U.S. companies.

Instead, our equity indices methodology identifies several eligibility criteria that new index additions must meet, including, but not limited to, market capitalization and liquidity thresholds, along with a history of positive earnings. Exhibit 1 provides an overview of these requirements.

Satisfying the eligibility rules does not guarantee index addition: the Index Committee takes into account several factors when considering constituent changes to the S&P 500, such as sector representation and index turnover. These constituent considerations—and indeed any resulting changes—are made on an ongoing, as-needed basis rather than on a set frequency.

Potential Impacts of Tesla’s Addition

Tesla’s float market capitalization of USD 304 billion (as of the close on Nov. 16, 2020) would make it the largest S&P 500 addition ever. Indeed, it is currently around two and a half times larger than Berkshire Hathaway (USD 127 billion) and nearly three times larger than Facebook (USD 90 billion) when they were added in February 2010 and December 2013, respectively.

Importantly, the growth of the S&P 500’s market capitalization over the last decade—from USD 9 trillion to around USD 30 trillion today—means that Tesla’s weight upon addition (1%, using Nov. 16’s close) would be less than Berkshire Hathaway’s 1.3% index weight when it was added.

From a sector perspective, Tesla’s addition is also likely to increase the weight of Consumer Discretionary in the index and help to alleviate the benchmark’s sensitivity to the Information Technology sector. For example, assuming all of Tesla were included at once, as of Nov. 16’s close the Consumer Discretionary sector would be 12.08% of the S&P 500 (this figure is based on the S&P 500 having 501 companies instead of its usual 500—the stock Tesla will replace in the index has yet to be announced by the Index Committee).

The potential change in the distribution of weights within the Consumer Discretionary sector—Tesla would currently be the second-largest sector constituent—may also reduce the sector’s sensitivity to Amazon.

The posts on this blog are opinions, not advice. Please read our Disclaimers.

Where Do You See Yourself in Five Years? China Stocks Up ahead of Their Latest Five-Year Plan

Contributor Image
Jim Wiederhold

Former Director, Commodities and Real Assets

S&P Dow Jones Indices

When discussing global economic recoveries, China is usually at the forefront of the conversation. As of Nov. 16, 2020, metal commodities with an industrial focus were the outperformers YTD. China is the world’s top industrial metal destination. Exhibit 1 shows the top 10 performing commodities tracked by S&P DJI. Seven metal commodities made it to the top 10. Recent rebounds in economic data points like PMIs and Industrial Production point to an increased appetite from China for these industrial commodities compared to what was witnessed during the doldrums of the COVID-19 global lockdown earlier this year, as well as any time over the last two years.

The S&P GSCI Iron Ore outperformed all other commodities, up 68.19% YTD. Chinese steel production and stockpiling played a big role in the demand for iron ore. With its higher industrial use, silver has outshined gold so far, with a 34.39% YTD return compared to 20.87% for the latter. The five LME-based commodities making up the S&P GSCI Industrial Metals are performing admirably, with the S&P GSCI Copper up 14.77% YTD. China’s demand for copper picked up considerably this year starting in June, and it remained elevated through the end of October. With two months of the year left, China has already imported a YTD record high 5.6 million tons of copper, outpacing 2015 by several thousand tons.

China’s increased appetite for feed grains pushed several major agriculture commodities to multi-year highs, as livestock populations rebounded impressively this year after last year’s decimation from African Swine Fever. In a previous blog, we highlighted the reasons behind the S&P GSCI Soybeans strong YTD performance. Its use as a source of feed appealed to Chinese buyers, especially as the commodity traded near five-year lows earlier this year and the U.S.-China trade war showed signs of a resolution; China committed to a record high level of purchases of U.S. soybeans this sowing season. China is on pace to shatter all previous grain purchasing records. More recently, local corn prices in China were pushed to record highs. A domestic shortfall of corn stocks led China to go on a buying spree over the last few months.

Despite attempts by the Communist People’s Party to become more self-sufficient in the grain markets, this year demonstrated how reliant they are on key commodity markets. China’s 14th Five-Year Plan clearly exposed which commodities they will focus on over the next five years. As China enters a new stage of development, this latest five-year plan shows the country’s determination to position itself as a world leader in emerging technologies, with more novel commodities like rare earth metals being a growing focus.

S&P DJI offers a suite of broad and single-commodity indices tracking commodity prices around the world. Explore our Commodities Indices to find out more about the strategies and insights we offer.

The posts on this blog are opinions, not advice. Please read our Disclaimers.

Motions of the Market

Contributor Image
Anu Ganti

U.S. Head of Index Investment Strategy

S&P Dow Jones Indices

The S&P 500® rose by 10% in the 12 months ending on Oct. 31, 2020, trouncing the S&P 500 Equal Weight Index by 9.1%, as seen in Exhibit 1. While such outperformance is not unprecedented, it does remind us of previous market peaks (especially in December 1999), and raises questions about whether a reversal may be in the cards.

While these periods may feel similar, they have notable differences. It is important to remember that by definition, the capitalization-weighted S&P 500 has no factor tilts. We can, however, look under the market’s figurative hood by analyzing the differences between the S&P 500 and its average constituent, represented by the S&P 500 Equal Weight Index. Exhibit 2, excerpted from our monthly factor dashboard, shows the factor tilts of the S&P 500 Equal Weight Index, relative to the (capitalization-weighted) S&P 500.

Currently, the equal weight version has a strong tilt away from low volatility and momentum, and a slight tilt away from quality. It also has exposures toward small size, dividend yield, high beta, and value. In other words, compared to the average stock in the index, the S&P 500 itself is less volatile, more momentum-oriented, more expensive, and much larger.

But when we go back further in history, we observe significant differences between today’s factor dynamics compared to those in December 1999. We observe in Exhibit 3 that like today, the equal weight version had a strong tilt away from momentum and toward small size, but that is where the similarities end. Twenty years ago, the S&P 500 Equal Weight Index barely had a tilt away from low volatility, deeper exposures to quality and dividend yield, along with a strong tilt away from high beta. Therefore, compared to the average constituent, the S&P 500 was much more volatile and not as durable from a quality perspective.

The fact that today’s market is less volatile and of higher quality compared to 1999 is not surprising, as the companies within Information Technology, the S&P 500’s largest sector then and now, are both more profitable and less volatile than they were 20 years ago. While we cannot predict whether the market’s upward trajectory is sustainable, history enables us to better understand the motions of the market from a factor lens.

The posts on this blog are opinions, not advice. Please read our Disclaimers.