Get Indexology® Blog updates via email.

In This List

The S&P/B3 Brazil ESG Index – Introducing Sustainable Investing in Brazil

SPIVA® U.S. Mid-Year 2020 Scorecard: Convergence to Underperformance

Introducing the S&P Risk-Managed Target Date Indices

China A-Share Inclusion – An Update One Year Later

Introducing the S&P Sustainability Screened Index Series: A Mainstream Approach to Sustainable Investing

The S&P/B3 Brazil ESG Index – Introducing Sustainable Investing in Brazil

Contributor Image
Cristopher Anguiano

Senior Analyst, U.S. Equity Indices

S&P Dow Jones Indices

The search for strategies that identify risks and growth opportunities with a motivation in sustainable investing has never been higher for emerging markets. Environmental, social, and governance (ESG) investing provides a way for investors to go above and beyond traditional financial considerations by focusing on a variety of impactful topics relevant to corporations. These topics include how companies interact with their employees, the communities they operate in, their commitment to the environment, and how they encourage change and innovation, to name a few.

The rapid growth and relevance of sustainable investing over the past years has made it a cornerstone in the investment selection process, so the presence of a broad ESG benchmark for the largest market in Latin America was necessary. Aimed toward ESG-oriented investors, S&P Dow Jones Indices launched on Aug. 31, 2020, the S&P/B3 Brazil ESG Index, an ESG-weighted index following a straight set of rules suitable for the Brazilian market, with a focus on sustainability and ESG principles similar to those of the S&P 500® ESG Index.

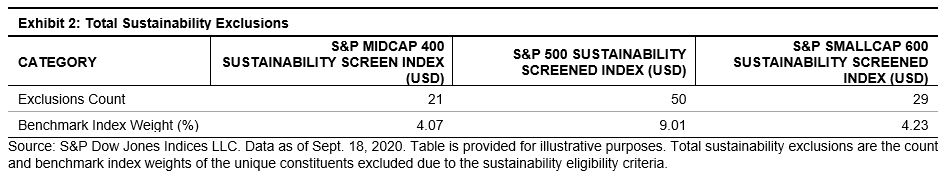
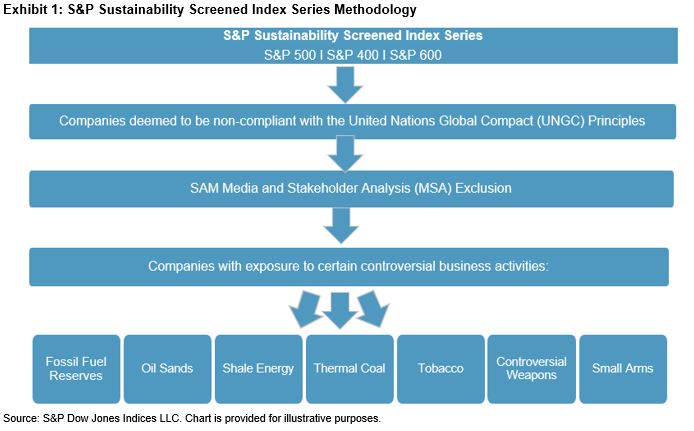
Using the S&P Brazil BMI as its underlying index, companies are excluded based on the following criteria:

  • Business activities related to tobacco, controversial weapons, and thermal coal;
  • United Nations Global Compact (UNGC) non-compliance;1
  • S&P DJI ESG Score; and
  • Media and stakeholder analysis controversies.

In the most recent rebalance on April 30, 2020, the resulting universe consisted of 96 constituents.

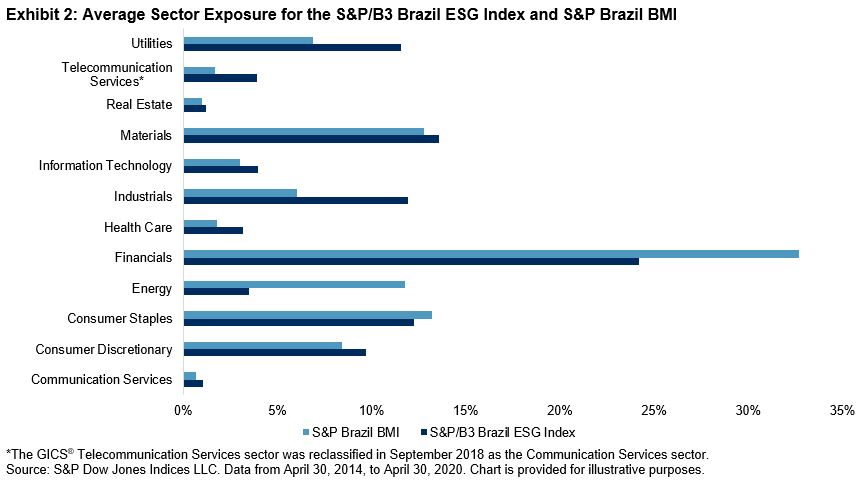
Companies are weighted by ESG score, which is subject to a liquidity cap aimed to improve liquidity. During the April 2020 rebalance, examining 25% of the past six months’ median value traded shows that a BRL one billion ticket can be traded on average in less than one day. In addition, average sector exposure decreased for Consumer Staples, Energy, and Financials. In contrast, all other sectors’ exposure increased.

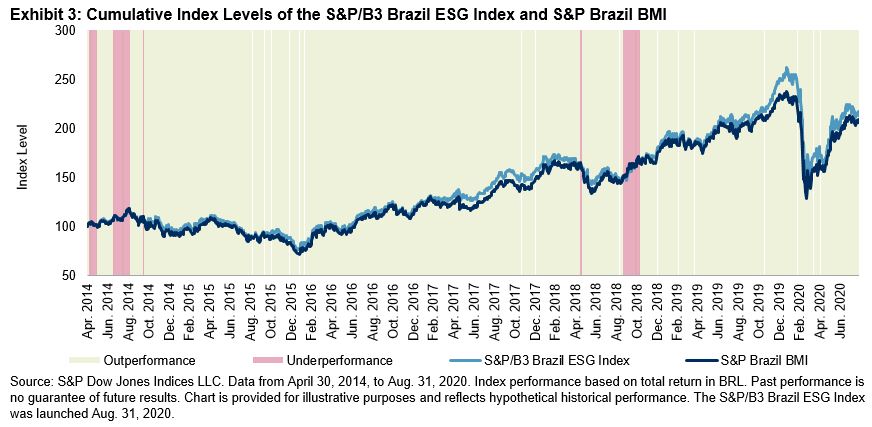
The index moves similar to its benchmark and exhibits an average annualized beta of 0.9 and annualized tracking error that oscillates around 6%. In March 2020, the S&P/B3 Brazil ESG Index experienced an increase in beta and tracking error, displaying a beta close to 1 and a 6.5% tracking error due to the COVID-19 pandemic, when global markets suffered large losses. We can see this movement in the cumulative level chart in Exhibit 3 at the end of Q1 2020. It is relevant to highlight that the strategy not only achieved a risk/return profile similar to that of the S&P Brazil BMI, it also outperformed in more than 90% of the historical observations.

From an ESG perspective, the S&P/B3 Brazil ESG Index was able to improve its ESG score relative to that of the S&P Brazil BMI. During its most recent rebalance, the overall ESG score of the S&P/B3 Brazil ESG Index increased from 47.9 to 57.7, an improvement of 9.8 points; considering that the maximum attainable ESG score of any strategy using the S&P Brazil BMI is 95.9, the ESG realized potential was 20.4%.

Overall, the S&P/B3 Brazil ESG Index is designed to be an alternative for investors that are looking for exposure to the broad Brazilian equities market while maintaining a focus on responsible investing, without losing the benefits of performance and liquidity.

The posts on this blog are opinions, not advice. Please read our Disclaimers.

SPIVA® U.S. Mid-Year 2020 Scorecard: Convergence to Underperformance

Contributor Image
Berlinda Liu

Former Director, Multi-Asset Indices

S&P Dow Jones Indices

According to the SPIVA U.S. Mid-Year 2020 Scorecard, most active fund managers in the U.S. underperformed the market over the past year. Among actively managed domestic equity funds, 67% lagged the S&P Composite 1500® during the 12 months ending June 30, 2020, and the majority of active managers underperformed their benchmarks in 11 out of the 18 categories of domestic equity funds.

The past year was marked by performance divergence and extreme volatility. For example, while the majority of large-cap and multi-cap funds lagged their benchmarks, mid-cap and small-cap active funds performed better. Similarly, growth funds led across all capitalization segments in the one-year period, while value funds in general continued to lag their benchmarks over all time horizons (see Exhibit 1).

Despite divergent results over the one-year horizon, median fund managers across all domestic equity categories underperformed their benchmarks over the past 15 years. This is not surprising–our latest Fleeting Alpha report shows that, even if an active fund manages to beat the benchmark in one period, it is difficult to keep its positive excess return in the following years. In longer investment horizons, the standard deviation of active fund returns tends to diminish; eventually, a fund’s returns start to resemble a normal distribution with its median below the benchmark’s return.

Taking large-cap funds as an example, Exhibit 2a plots the distribution of annualized fund returns in the past 1-, 5-, and 15-year periods, with the S&P 500® annualized returns shown as the dotted lines. In the one-year period, most funds can be sorted into discrete and distinct groups of winners and losers relative to the benchmark. However, as the investment horizon lengthens, these two groups gradually converge and the returns from all funds resemble a continuous normal distribution despite its long tail and skew. Exhibit 2b further confirms that the standard deviation of fund returns decreases steadily as the investment horizon lengthens. In all periods, the average and median large-cap managers underperformed the benchmark.

Data from the SPIVA Mid-Year 2020 Scorecard are clear: short-term outperformance tends not to persist. The most likely path for short-term outperformers is convergence to mediocrity, as most actively managed mutual funds fall short of benchmark returns in the long run.

The posts on this blog are opinions, not advice. Please read our Disclaimers.

Introducing the S&P Risk-Managed Target Date Indices

Contributor Image
Smita Chirputkar

Former Director, Global Research & Design

S&P Dow Jones Indices

S&P DJI recently launched the S&P Risk-Managed Target Date Indices. In this post, we will explore the characteristics of these indices in detail.

Each index consists of two component indices: a baseline S&P Target Date Index based on an underlying glide path and an S&P 500® Managed Risk 2.0 Index. The S&P 500 Managed Risk 2.0 Index seeks to stabilize the volatility around a target level and provides downside protection during sustained market declines

The baseline S&P Target Date Indices comprise three baseline glide paths1—conservative, moderate, and aggressive—and Exhibit 1 shows how asset allocation changes based on the type of glide path.

The aggressive glide path offers the highest equity allocation, the conservative glide path offers the smallest equity allocation at all the stages of retirement, and the moderate glide path offers an equity allocation level in between those two. As expected, as a person approaches retirement, the equity allocation decreases across all glide paths. The basic premise is that a person who is far away from retirement is able to take more risk by allocating a significant portion of their portfolio to equities. For example, for a person who is 40 years away from retirement (25 years of age), the equity allocation for the aggressive glide path is 94.6%, while the equity allocation for the conservative glide path is 81.5%. The three baseline indices are constructed using these underlying glide paths for each vintage starting from 2015 until 2060 in five-year increments.

In order to provide stability during volatile market conditions, the baseline indices are combined with an S&P 500 Managed Risk 2.0 Index. The allocation to the S&P 500 Managed Risk 2.0 Index varies across different glide paths. This allocation is dynamically linked to the baseline equity allocation rather than being static, in order to better reflect the market conditions. Exhibit 2 shows the asset allocation mix of the baseline indices and their corresponding S&P 500 Managed Risk 2.0 Index. The allocation to the managed risk component decreases over time across all glide paths as the person moves away from the retirement date, indicating that near-retirees2 need more downside protection than pre-retirees,3 as they have less time to recover any potential losses before they hit the retirement age of 65.

In the next blog, we will explore the performance of the S&P Risk-Managed Target Date Indices and see how the addition of a risk component helped the strategies withstand the recent market downturn caused by the COVID-19 pandemic.

The posts on this blog are opinions, not advice. Please read our Disclaimers.

China A-Share Inclusion – An Update One Year Later

Contributor Image
Michael Orzano

Head of Global Exchanges Product Management

S&P Dow Jones Indices

As we mark the one-year anniversary of the initial inclusion of China A-shares in S&P DJI’s global benchmarks, it seems an opportune time to provide an update on key developments relating to A-share inclusion and to examine the impact that A-shares have had on the composition and performance of the S&P Emerging BMI over the past year.

Understanding the A-Share Inclusion Process, and What to Expect Next

Effective Sept. 23, 2019, eligible China A-shares accessible via Hong Kong-Shanghai Stock Connect or Hong Kong-Shenzhen Stock Connect were added to S&P DJI’s global benchmarks at a 25% reduced inclusion factor—meaning each company was represented at one-quarter of its float market cap weight.

Following a consultation with market participants earlier this year, S&P DJI announced that A-shares listed on the ChiNext Board of the Shenzhen Stock Exchange that are also accessible via Stock Connect would be eligible for the S&P Global BMI and other benchmark indices as of the September 2020 reconstitution. These additional ChiNext-listed securities represented an additional 1.0% weight added to the S&P Emerging BMI at the September 2020 reconstitution.

While we are not currently proposing an increase in the 25% partial inclusion factor nor any additional changes to eligibility requirements, S&P DJI’s 2020 Country Classification Consultation provides an overview of recent steps taken by Chinese authorities to improve accessibility to A-shares, as well as key remaining challenges cited by institutional investors. These challenges include relatively low foreign ownership limits, daily trading limits on Stock Connect facilities, and a lack of full alignment between trading days of Stock Connect and the underlying Chinese exchanges. The consultation invites feedback as to whether S&P DJI should consider proposing any changes to its treatment of A-shares and what additional steps need to be taken in order to consider increasing the inclusion factor or expanding eligibility beyond securities accessible via Stock Connect.

A-Shares Enhanced Emerging Market Returns since Inclusion while Contributing to Lower Volatility

Despite their reputation as a volatile and risky segment of the global equity market, the presence of A-shares in emerging market indices improved performance and reduced risk over the past year. As illustrated in Exhibit 1, the S&P Emerging BMI outperformed the S&P Emerging Ex-China A BMI (which excludes all China A-shares) over the past year while also exhibiting slightly lower volatility.

More broadly, Chinese equities were the main positive contributor to emerging market returns over this period, pushing the S&P Emerging BMI to a 9.5% gain. While the index would have gained a lesser 8.2% over this period excluding A-shares, removing China entirely would have led to a decline of 2.0%, with meaningfully higher volatility.

Drilling deeper, Exhibit 2 illustrates the high dispersion in emerging market returns and the notable outperformance of China relative to other emerging markets over the past 12 months. In fact, Taiwan was the only market to outperform China, and just 6 of the 25 markets posted positive returns.

China’s Growing Dominance in Emerging Market Equity Benchmarks

China’s weight in the S&P Emerging BMI increased markedly over the past 12 months, driven both by its relatively strong performance and the addition of A-shares to the benchmark. Prior to the inclusion of A-shares, China was already the largest market by a wide margin, representing 32% of the S&P Emerging BMI. The initial partial inclusion of A-shares boosted its weight to 36% following the September 2019 index reconstitution. As of the September 2020 reconstitution, China represents approximately 44% of the benchmark, with A-shares representing an 8% weight.

While the future path for A-share inclusion remains uncertain, it will likely be dependent on further market accessibility enhancements. Despite A-shares being only partially represented in global equity benchmarks, one thing is certain: China’s size makes it the dominant driver of the emerging market equity landscape.

The posts on this blog are opinions, not advice. Please read our Disclaimers.

Introducing the S&P Sustainability Screened Index Series: A Mainstream Approach to Sustainable Investing

Contributor Image
Margaret Dorn

Senior Director, Head of ESG Indices, North America

S&P Dow Jones Indices

As a pioneer in the index space, S&P DJI has long understood the necessity for evolving indices to address the changing needs of the investor. In recent years, one significant development has been the growing focus on sustainable investing and an increased demand from investors to find strategies more in line with their value and belief systems.

In response to such demand, S&P DJI has looked to diversify the ways in which market participants can gain access to more sustainable investment strategies. The launch of the S&P ESG Index Series in January 2019 represented a momentous step in integrating ESG metrics and scores into the core of an investor’s portfolio. With the recent launch of the S&P Sustainability Screened Index Series, investors now have yet another opportunity to access broad market exposure to S&P DJI’s headline benchmarks—S&P 500®, S&P MidCap 400®, S&P SmallCap 600®—but in an even simpler way. Instead of screening companies by ESG scores and seeking to maintain industry neutrality to the benchmark index, the S&P Sustainability Screened Indices focus only on screening out companies with exposure to controversial business activities, regardless of how that might impact sector or industry composition.

The S&P Sustainability Screened Indices—S&P 500 Sustainability Screened Index, S&P MidCap 400 Sustainability Screened Index, and S&P SmallCap 600 Sustainability Screened Index—seek to exclude companies with specific fossil fuel reserves,1 as well as companies with involvement in controversial business activities widely accepted as conflicting with responsible investing practices (see Exhibit 1). A company’s level of involvement is defined via various revenue thresholds and eligibility criteria that determine the basis for which a company is excluded from the eligible universe. For example companies that are found to be involved in the manufacturing, sale, or distribution of assault weapons and/or small arms, as well as their key components, are deemed ineligible for inclusion in the index.2

In addition to these key business involvement screens, companies are also assessed based on their compliance with the principles of the U.N. Global Compact.3 Companies that do not act in accordance with the associated standards, conventions, and treaties are ineligible for the index. The addition of this screen allows for the index to account for companies with violations linked to human rights, labor, environment, and corruption abuses.

Last, but certainly not least, it is also essential that the index series address any controversial events that could adversely affect both the reputational standing and shareholder value of the company. In order to appropriately address such events, the indices have a built-in review process known as the SAM Media and Stakeholder Analysis (MSA).4 The MSA was developed to formally review and remove those companies involved in activities related to economic crimes, fraud, and human rights issues. In essence, the MSA is used as a system of “checks and balances” to ensure that a company is upholding the policies and business standards that they claim to their stakeholders.

Once the sustainability eligibility criteria are applied, the remaining constituents are weighted by market capitalization and rebalanced on a quarterly basis. The end result is benchmark-like exposure to the S&P 500, S&P MidCap 400, and S&P SmallCap 600, but with a notable decrease in allocation to companies and industries deemed undesirable in the eyes of the sustainability minded investor (see Exhibit 2).

While these new indices are straightforward in their approach to sustainable investing, the outcome of applying such screens has proven positive from both an investment returns perspective—all three of the S&P Sustainability Screened Indices have historically outperformed their respective benchmarks (see Exhibit 3)—as well as delivered on numerous sustainable outcomes such as zero exposure to companies with fossil fuel reserve emissions or those that directly manufacture tobacco-related products, just to mention a few. With such favorable results, these indices provide an appealing sustainable investing option for those on a mission to better align their investment objective with their values and what an admirable quest it is!


1   Fossil fuel reserves are calculated by Trucost, part of S&P Global. Fossil fuel reserve exclusions include cases where Trucost does not cover constituents, in addition to the constituents excluded due to their fossil fuel reserves.

2   As of each rebalancing reference date, companies with specific Levels of Involvement, as specified and measured by Sustainalytics.  Level of Involvement refers to the company’s direct exposure to such products, while Significant Ownership indicates where the company has indirect involvement via some specified level of ownership of a subsidiary company with involvement. Please refer to www.sustainalytics.com

3   Companies are assessed according to Sustainalytics’ Global Standards Screening (GSS). For more information on Sustainalytics, please refer to www.sustainalytics.com

4   For more information on SAM’s approach, see https://portal.csa.spglobal.com/survey/documents/MSA_Methodology_Guidebook.pdf

The posts on this blog are opinions, not advice. Please read our Disclaimers.