Get Indexology® Blog updates via email.

In This List

S&P/ASX All Technology Index Proved Resilient through the Pandemic: An Update Following the Q2 Rebalance

BBB Bond Downgrades Added USD 88 Billion to the High-Yield Bond Market YTD

Have Defensive Sectors Stood the Test of Time in Global Markets?

Taking Up the Challenge of Turbulent Markets with ESG and Multi-Assets

Like the Virus, Credit Spreads Could Be at Risk of a Possible Second Wave

S&P/ASX All Technology Index Proved Resilient through the Pandemic: An Update Following the Q2 Rebalance

Contributor Image
Michael Orzano

Head of Global Exchanges Product Management

S&P Dow Jones Indices

The Australian technology industry roared back to life following a steep first quarter selloff. After peaking on Feb. 17, 2020, the S&P/ASX All Technology Index plunged 46.8%, bottoming on March 23 at the height of the pandemic-led market selloff. Around this time, however, investors realized that Australia’s technology-oriented companies—many of which are involved in innovative payment processing solutions, software development, and in supporting e-commerce across various industries—were likely to be less affected by—and may even benefit from—the pandemic-related economic and social dislocations.

Between the low on March 23 and June 19, 2020, the index gained a whopping 84.4%, leaving it just 2% off its all-time high and up nearly 10% YTD. Meanwhile, the broad market S&P/ASX 200 remained down about 10% for the year. As illustrated in Exhibit 1, the S&P/ASX All Technology Index outperformed all major sectors of the Australian stock market by a wide margin YTD and over the past 12 months.

Broad-Based Contribution Drove Index Rebound

Drilling down into stock-level performance, we can see that although Afterpay was a clear standout, gaining nearly 560% and accounting for about one-quarter of the index’s total return since the March 2020 low, the overall rebound in index performance was broad based. In fact, all 46 constituent companies posted positive returns between March 23 and June 19, 2020, and about one quarter of the total index return was generated by companies outside of the top 10 contributors.

Addition of Seek Headlines First Post-Launch Index Rebalance

The S&P/ASX All Technology Index underwent its first rebalance since launching in February 2020, and the review resulted in five company additions and one deletion. Best known for its online job matching platforms, Seek was added to the index following its GICS reclassification from Human Resources and Employment Services, which is not eligible for inclusion, to Interactive Media and Services, which is eligible. With a float market cap in excess of AUD 7 billion, Seek entered the index as the third-largest constituent with a weight of 8.7%. Nitro Software and Tyro Payments, both of which went public in December 2019, were also added, as were RPMGlobal Holdings and Temple & Webster Group. Over the Wire Holdings was the only existing constituent dropped from the index.

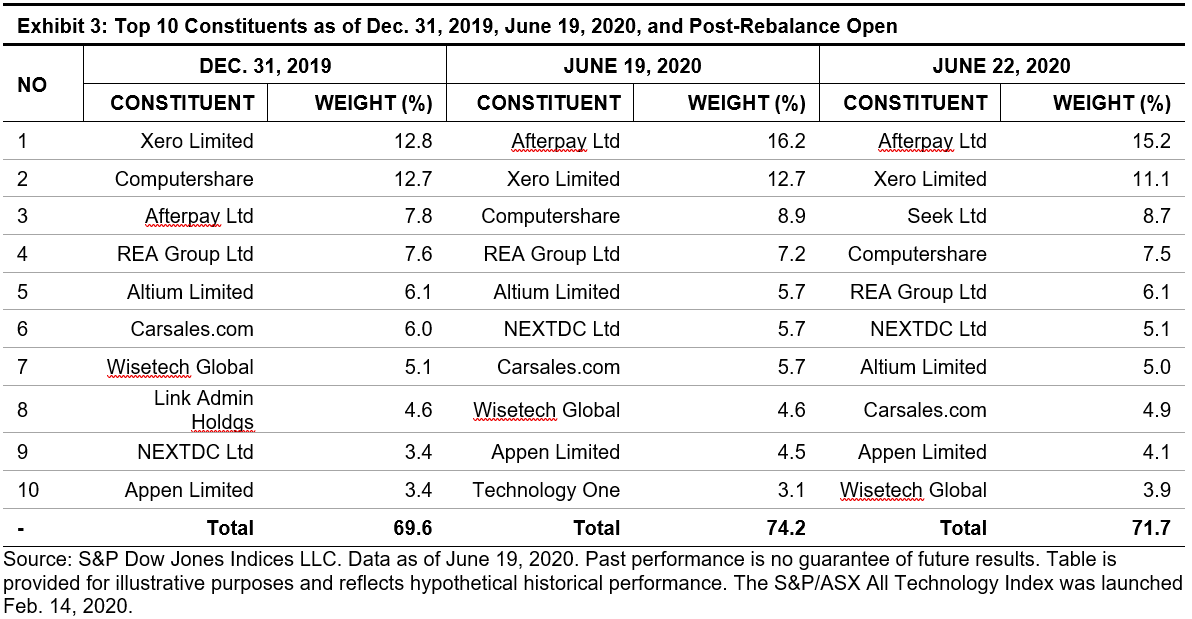
Exhibit 3 illustrates the index composition changes between the end of 2019, the close of June 19, 2020, prior to the rebalance, and the open of June 22, 2020, which reflects the rebalance changes. Afterpay’s nearly 90% YTD share price gain propelled it to the top position, as its index weight nearly doubled. The rise of NextDC from ninth to sixth place was also notable. Finally, the addition of Seek helped to improve the diversification of the index, reducing concentration among the largest components.
The combination of solid returns, the addition of Seek and new technology IPOs has further increased the depth and breadth of Australia’s technology industry. As of June 22, 2020, the total market cap of the S&P/ASX All Technology Index was nearly AUD 116 billion, up 26% from the end of 2019 and nearly double the AUD 63 billion reached at the end of 2018. The index also reached an all-time high in the number of constituents at 50.

It’s been a wild ride since the launch of the S&P/ASX All Technology Index in February 2020. However, the Australian technology industry has been resilient and clearly demonstrated its role as a unique, high-growth area of the Australian equity market during difficult times.

The posts on this blog are opinions, not advice. Please read our Disclaimers.

BBB Bond Downgrades Added USD 88 Billion to the High-Yield Bond Market YTD

Contributor Image
Hong Xie

Former Senior Director, Global Research & Design

S&P Dow Jones Indices

In recent years, one noticeable development in the corporate bond market has been the rapid growth of the BBB bond market in terms of its absolute amount and relative share of investment-grade corporate bonds. We wrote a blog on this topic in May 2019 detailing the growth of the BBB bond market and its impact on the credit fundamentals of the overall investment-grade bond sector. As of May 2020, BBB corporate bonds grew by 214% to USD 3.6 trillion over the past 10 years, while their share in overall investment-grade bonds increased from 38% to 54%.

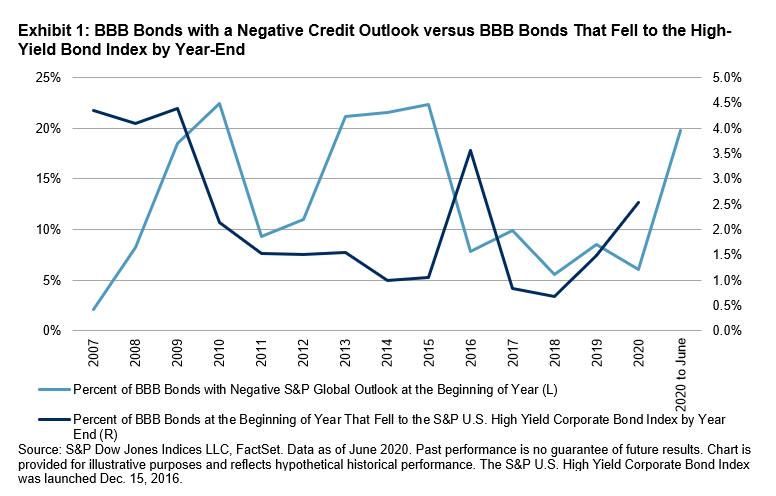
Prior to the recent market turmoil due to COVID-19, the rapid increase of BBB bonds had already raised concerns among investors that the high-yield bond market might have difficulty absorbing a wave of potential downgrades with a credit market correction. Some investors have been paying closer attention to the rating outlooks for BBB bonds to monitor their overall credit quality. In this blog, we review the historical composition of BBB bonds with negative credit outlooks and the annual transition of bonds that started the year with BBB ratings but were downgraded to join the high-yield bond index by year-end. The BBB bond and high-yield bond universes are represented by the S&P U.S. Investment Grade Corporate Bond BBB Index and S&P U.S. High Yield Corporate Bond Index, respectively.

Exhibit 1 compares (1) the share of BBB bonds with a negative S&P Global ratings outlook at the beginning of the year and (2) the share of BBB bonds that were downgraded to join the high-yield bond index by year-end. Historical data since 2007 shows that, as expected, BBB bonds with a negative rating outlook were not always downgraded to a high-yield rating within a year’s time (2010-2015). However, as of June 16, 2020, 2.5% of BBB bonds had been downgraded to high-yield bonds since the beginning of the year, higher than the average of 1.0% over the past three years.

Exhibit 2 shows the annual transition of BBB bonds to the S&P U.S. High Yield Corporate Bond Index from the beginning of the year to the end of the year. The share of BBB bonds that were downgraded to below an investment-grade rating has been on the rise since 2019. As of June 16, 2020, 5.2% of the S&P U.S. High Yield Corporate Bond Index came from the S&P U.S. Investment Grade Corporate Bond BBB Index as of the end of 2019, the highest since 2009 and 2016. These fallen angel bonds from the BBB rating alone have added USD 88 billion of supply to the high-yield bond universe so far this year. Exhibit 2 also shows that as of June 2020, the share of BBB Bonds with negative credit outlook from S&P has gone up to 20% compared to 6% from the beginning of the year.

The credit market has seen a significant widening of spreads during the COVID-19 selloff. With the Fed’s aggressive measures of purchasing corporate bonds and ETFs, credit spreads have retraced 83% and 72% of the recent widening in the investment-grade and high-yield bond markets, respectively, as of June 16, 2020. However, as Fed Chairman Jerome Powell warned this week, a full U.S. economic recovery will not occur until the pandemic has been brought under control, and significant uncertainty remains about the timing and strength of the recovery. A slow economic recovery combined with plunging oil prices should keep pressure on credit quality and rating downgrades. Rating downgrades in BBB bonds particularly could contribute meaningfully to the supply of high-yield bonds and need to be closely monitored.

The posts on this blog are opinions, not advice. Please read our Disclaimers.

Have Defensive Sectors Stood the Test of Time in Global Markets?

Contributor Image
Qing Li

Director, Global Research & Design

S&P Dow Jones Indices

In March 2020, the S&P Global BMI TR declined 14.3%, marking its third-worst month over the past 25 years. Meanwhile, some sectors within the index recorded significant outperformances compared with the broader market. The S&P Global BMI Health Care, S&P Global BMI Consumer Staples, and S&P Global BMI Utilities surpassed the benchmark by 9.9%, 8.9%, and 2.4%, respectively.

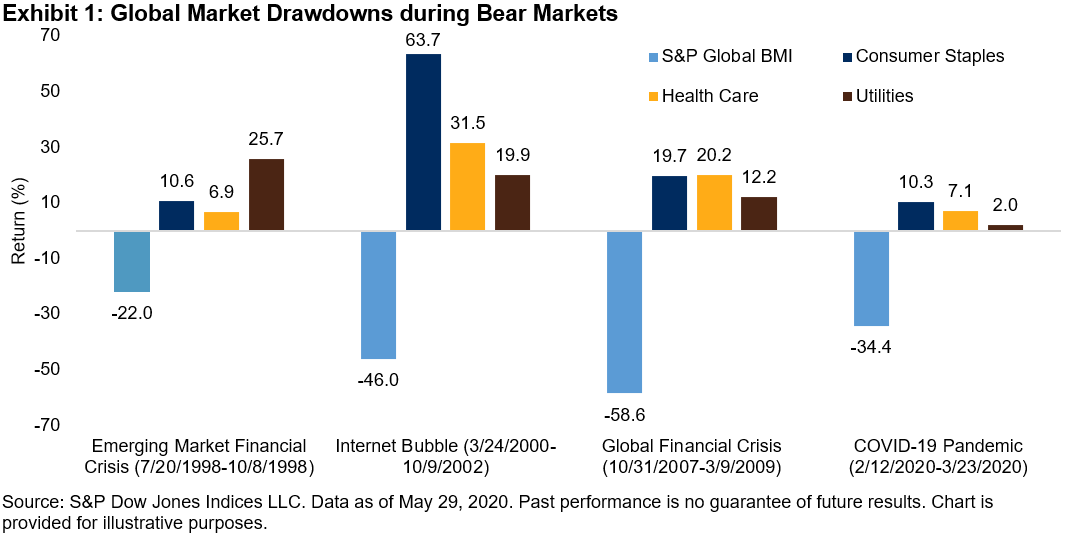
Since Dec. 31, 1994, the global equity market has experienced four severe downturns when the S&P Global BMI TR declined 20% or more. However, three sectors—consumer staples, health care, and utilities—stayed in positive territory during all the drawdowns. Exhibit 1 shows how these sectors performed during the four worst drawdown periods. While the broader market suffered an average 40% loss, the gains from consumer staples, health care, and utilities sectors averaged 26%, 16%, and 15%, respectively.

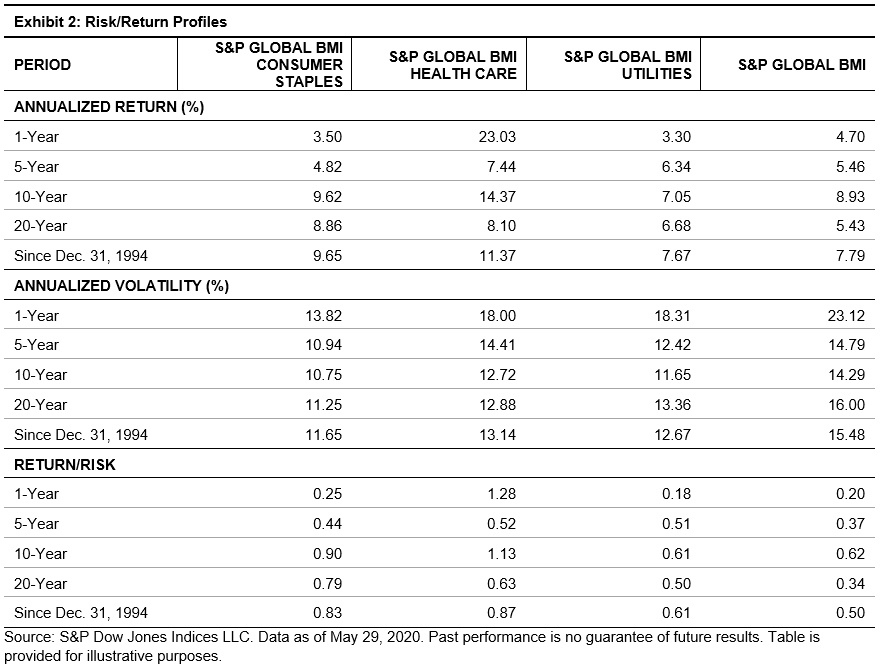
Over the long run, the consumer staples, health care, and utilities sectors generated the highest excess risk-adjusted returns. From the end of 1994 through May 29, 2020, the risk-adjusted returns from the consumer staples, health care, and utilities sectors were 0.83, 0.87, and 0.61, respectively, greatly exceeding the benchmark’s 0.50. In addition, as shown in Exhibit 2, the three sectors produced significant excess returns over almost all investment horizons. One year through 2020, consumer staples, health care, and utilities have delivered risk-adjusted returns of 0.0.25, 1.28, and 0.18, respectively, compared to the 0.20 generated by the benchmark.

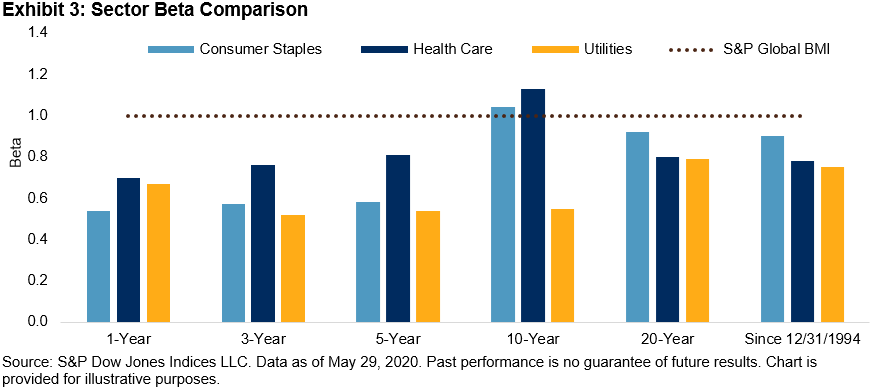
The underlying business models helped to make the consumer staples, health care, and utilities sectors less sensitive to economic cycles and more resistant to the market downturns. The consumer staples sector includes companies that provide goods and services such as food, beverages, and non-durable household products. The health care sector is composed of companies that provide medical and related products and services, and the utilities sector comprises companies that produce and deliver electricity, gas, or water to their customers. The products and services in these sectors are essential items that people need during all phases of the economic cycles, regardless of financial conditions. The stable demand can help these sectors generate steady revenues under various economic situations. As shown in Exhibit 3, the betas over various investment horizons indicate that these sectors were much less sensitive to the market.

The consumer staples, health care, and utilities sectors have had strong performance during the market slowdowns when observed over the short and long term. Understanding the sector characteristics, performance, and volatility profile can help investors decide on appropriate investments, participate in growth opportunities, and benefit during challenging times.

The posts on this blog are opinions, not advice. Please read our Disclaimers.

Taking Up the Challenge of Turbulent Markets with ESG and Multi-Assets

Contributor Image
Claire Yi

Former Analyst, Strategy Indices

S&P Dow Jones Indices

After a long bull market, the COVID-19 pandemic has shaken the financial markets and put the question of how to earn a smooth return stream over a long period of time back on the table. This has given rise to a strengthening of conviction toward environmental, social, and governance (ESG) investing and risk management.

S&P Dow Jones Indices recently launched the S&P ESG Global Macro Index, which is designed to deliver stable returns through various market conditions and to align investments with ESG values.

The index exploits dynamic allocation between regional diversified bonds and ESG-themed equities based on economic and market trend signals and aims for a stable risk level by adjusting allocation between the portfolio and cash on a daily basis.

Over nearly the past 10 years, the index delivered an annualized return of 5.43%, volatility of 4.87%, a Sharpe ratio of 1.12, and a maximum drawdown of 6.35%. During the COVID-19 sell-off, the S&P 500® ER[1] fell 34.09% from Feb. 19, 2020, to March 23, 2020, while the S&P ESG Global Macro Index returned -4.44%.

Two key aspects of the index design are 1) ESG value alignment and 2) diversification through dynamic asset allocation. Both aim to mitigate the negative impact on index return during market turbulence.

ESG Value Alignment

The equity basket of the S&P ESG Global Macro Index consists of the S&P 500 ESG Index, S&P Europe 350 ESG Index, and S&P Japan 500 ESG Index. Theses indices are composed of companies with the top 75% S&P DJI ESG Scores within each industry group, while excluding companies involved with tobacco or controversial weapons, or with low United Nations Global Compact scores. These indices provide meaningful ESG performance improvement with little tracking error against the non-ESG benchmarks.

During the COVID-19 sell-off,[2] the S&P 500 ESG Index and S&P Europe 350 ESG Index outperformed their benchmarks by 0.69% and 0.24%, respectively, while the S&P Japan 500 ESG Index slightly underperformed its benchmark by 0.23%.

Dynamic Allocation

The dynamic allocation mechanism used in the S&P ESG Global Macro Index has historically been effective at reducing risk and improving risk-adjusted return.

To demonstrate this, we constructed a hypothetical multi-asset portfolio that mimics the exact setting of the S&P ESG Global Macro Index, except that the allocation to equity and bond baskets are at constant 60% and 40%, rather than dynamically determined by macroeconomic and market trend signals.[3]

Over nearly the past 10 years, the S&P ESG Global Macro Index provided a meaningfully higher absolute return and Sharpe ratio than the hypothetical portfolio, with the same level of volatility and slightly lower maximum drawdown (see Exhibit 2).

How did the index typically perform in bear and bull markets? We showcase two historical scenarios.

Scenario A: The Bear Market from Feb 19, 2020, to March 23, 2020

During the COVID-19 sell-off, the S&P ESG Global Macro Index shielded investors from large losses through its dynamic asset allocation and risk control overlay.

  • From Feb. 19, 2020, to March 10, 2020, the equity market tumbled, while bond prices increased. The index began this period with a 60% allocation to equities, and it switched entirely to bonds at the beginning of March. The negative correlation between equities and bonds helped to defend the portfolio levels from Feb. 19, 2020, to Feb. 28, 2020.
  • From March 11, 2020, to April 8, 2020, the oil price crash further triggered the market sell-off, in both the equities and bond markets. The daily risk control mechanism began to reduce exposure to bonds, which helped to reduce losses.

Scenario B: The Bull Markets in 2017 and 2019

In bull markets like those in 2017 and 2019, the S&P ESG Global Macro Index underperformed the S&P 500 ER. This comes as no surprise for a multi-asset index with a prudent volatility target. However, the index still delivered returns of 11.1% and 12.3% in 2017 and 2019, respectively, and with a higher Sharpe ratio than the S&P 500 ER in 2019.

The S&P ESG Global Macro Index aims to balance returns and risk in different market conditions. Historically, it has mitigated large losses from equities during bear markets while still delivering comparable Sharpe ratios during bull markets.

[1] The two-month U.S. dollar LIBOR interest rate and three-month U.S. dollar LIBOR interest rate are used to calculate the S&P 500 ER.

[2] The COVID-19 sell-off refers to the period from Feb. 19, 2020, to March 23, 2020, in the U.S. market; Feb. 19, 2020, to March 18, 2020, in the European market; and Feb 20, 2020, to March 16, 2020, in the Japanese market.

[3] The hypothetical portfolio allocates 60% to the equity basket (S&P 500 ESG Index, at 30%; S&P Europe 350 ESG Index, at 20%; and S&P Japan 500 ESG, at 10%) and 40% to the bond basket (S&P 10-Year U.S. Treasury Note Futures Index, at 20%; S&P Euro-Bund Futures Index, at 13.33%; and S&P 10-Year JGB Futures Index, at 6.67%), and it is rebalanced monthly. A 5% daily risk control overlay is applied.

The posts on this blog are opinions, not advice. Please read our Disclaimers.
Like the Virus, Credit Spreads Could Be at Risk of a Possible Second Wave

Contributor Image
Kevin Horan

Former Director, Fixed Income Indices

S&P Dow Jones Indices

Ever since the Fed released its tsunami of credit, credit markets have rallied the most since the depth of the Global Financial Crisis. Continued central bank actions have driven the already existing trend toward demand for higher-yielding assets, helping companies issue debt with fewer lender safeguards and covenants. With the Fed willing to support the markets and be the buyer of last resort, credit spreads have tightened since March 2020.

The option-adjusted spread (OAS) of the S&P U.S. Investment Grade Corporate Bond Index and the S&P U.S. High Yield Corporate Bond Index reached a YTD peak on March 23, 2020, while returns hit a low on March 19. Leveraged loans’ spread to Libor, as measured by the S&P/LSTA Leveraged Loan Index, topped out at L+980 on March 20.

Multiple Fed actions aimed at calming the markets led to the continued tightening of credit spreads. Though YTD spreads are wider than the beginning of the year for all ratings categories, the indices are substantially tighter since March 31, 2020, and have continued to tighten month-to-date as seen in Exhibit 2. The BBB category and all the high-yield indices have tightened by 150 bps or more, with the riskiest and lowest-rated CCC+ & below having tightened by 353 bps. CCC loans are more than double the CCC+ & below high-yield bonds when it comes to the spread change since March 31, 2020.

Just over these past few days, spreads have generally reversed direction, heading wider. This may be the beginning of a key reversal in the past rally experienced over the past weeks. Investment-grade debt issuance has trailed off, and the messaging from the Fed and economist centers around weakness, unemployment (20.9 million at the end of May 2020), and the heightened possibility of an economic downturn just as cities and states struggle with the questions of how to open up from the quarantine.

Exhibit 6 shows the total rate of return performance for the investment-grade and high-yield indices and the rating and industry subindices.

The posts on this blog are opinions, not advice. Please read our Disclaimers.