Get Indexology® Blog updates via email.

In This List

The Opportunity Cost of Active Management

Carlos Urzúa Resignation and Low Volatility’s Response

Palladium – All That Glitters Is Not Gold

Using Credit Ratios to Build Defensive Corporate Bond Portfolios

The Importance of Being Large-Cap

The Opportunity Cost of Active Management

Contributor Image
Akash Jain

Director, Global Research & Design

S&P BSE Indices

Investors typically flock to active funds to pass on the stock-picking decision making to a seasoned fund manager, with the hope that the fund manager’s experience and stock-picking capabilities will enable the investor’s portfolio to grow at a faster pace than that set by the benchmark. By using this approach, investors are able to circumvent one problem, only to get stuck in another problem: which fund manager to choose?

As seen in the SPIVA® India Year-End 2018 Scorecard, a large proportion of active fund managers underperformed the benchmark. Over the 10-year period observed, 64% of the large-cap funds underperformed the benchmark, the S&P BSE 100.

In the Indian Equity Large-Cap and Indian Mid-/Small-Cap categories, there was a wide spread in fund performance across different investment horizons (see Exhibit 1). For example, the spread in returns for an investor in two different large-cap funds over a 10-year horizon ending Dec. 31, 2018, could have been as high as 13.2% CAGR. Therefore, the selection of a fund can play a critical role in portfolio returns. The performance range in the case of the Mid-/Small-Cap category was even higher, at 14.92% over a 10-year horizon. The story remains the same across different time horizons. Furthermore, the average net returns generated by active funds were not far off from the benchmark returns (see Exhibit 1).

 We also studied the distribution of fund returns and calculated their mean, standard deviation, and skew (see Exhibit 2). The study compared the fund returns data distribution with a hypothetical normal curve constructed with the same mean and standard deviation. Again, we considered the large-cap category and mid-/small-cap category for this analysis.

  • Large-Cap Category: We witnessed a positive skew (skewed to the right), which implies that, generally speaking, the mean was higher than median, indicating that few funds generated extraordinary returns, pulling the category average higher whereas the performance of most funds lies to the left of the mean.
  • Mid-/Small-Cap Category: We noticed a negative skew (skewed to the left). This implies that the mean was less than the median, which means that only a few funds with large underperformance were dragging the mean down, but that most funds generated superior funds in this category.

This analysis indicates that, at least in the large-cap category, the majority of the funds failed to beat the category average.

What is more challenging is that the relative peer performance of a mutual fund has not been consistent (see Exhibit 3), which means that funds that have outperformed in one period failed to maintain their superior performance in the following periods. In Exhibit 3, funds were classified into four quartiles based on their performance over the five-year period between Dec. 31, 2008, and Dec. 31, 2013. The columns to the right showcase how many of the funds continued to outperform their peers over the period from Dec. 31, 2013, to Dec. 31, 2018. Some important inferences include the following.

  1. In the case of the large-cap fund category, only 14.8% of the 27 top-quartile funds continued to be in the top quartile the following five years. However, in the mid-/small-cap category, 42.9% of the 14 top-quartile funds continued to be in the top quartile in the following five years.
  2. The worst-performing funds have higher probability to continue their underperformance. For example, in the mid-/small-cap category, 35.7% of the 14 funds in the bottom quartile continued their underperformance and failed to break out from the bottom quartile.
  3. The highest number of fund mergers/liquidations was witnessed in the bottom quartile. For example, in the large-cap category, 35.7% of the 28 funds (i.e., 10 funds) in the bottom quartile failed to survive the period from 2013 to 2018.

The writing on the wall is clear. Fund outperformance is random and predicting an outperforming mutual fund may be as challenging as the stock-selection process. From a purely mathematical point of view, an investor has better odds of flipping a coin than identifying an outperforming active mutual fund. Therefore, investing via a systematic, style consistent, low-cost passive route could be a better bet for an investor.

The posts on this blog are opinions, not advice. Please read our Disclaimers.

Carlos Urzúa Resignation and Low Volatility’s Response

Contributor Image
Maria Sanchez

Director, Sustainability Index Product Management, U.S. Equity Indices

S&P Dow Jones Indices

Mexico’s Finance Minister, Carlos Urzúa, abruptly resigned on July 9, 2019 over policy disagreements with the current government.[1] Market participants reacted negatively, generating volatility in the Mexican peso’s exchange rate, which fell 2.3% right after the announcement,[2] and the country’s equity market, and bringing a trial by fire for the S&P/BMV IPC Risk Weighted Index (MXN).

The S&P/BMV IPC Risk Weighted Indices aim to offer upside participation and downside protection, which was evident in their performance after the recent events in Mexico. While the total return of the flagship S&P/BMV IPC lost 1.77% in a single day, the low volatility strategy for Mexico, represented by the S&P/BMV IPC Risk Weighted Index (MXN), fell just 1%. The S&P/BMV IPC Risk Weighted Index (MXN)’s one-day outperformance of 77 bps showed a reversal in the indices’ month-to-date performance and reduced the difference in year-to-date returns (see Exhibit 1).

The bad news of this event is that market sentiment perceives instability in Mexico.

The good news is that this event proved the advantages a low volatility strategy can provide.

[1] NYTimes.com: Mexico’s Finance Minister Resigns, Rebuking the President’s Policies

[2] Mexico Peso Falls as Investors Fret Over Finance Minister’s Exit – Bloomberg

The posts on this blog are opinions, not advice. Please read our Disclaimers.

Palladium – All That Glitters Is Not Gold

Contributor Image
Fiona Boal

Managing Director, Global Head of Equities

S&P Dow Jones Indices

Much has been made during recent months of the renewed interest investors have shown in gold on the back of growing financial market turbulence, a plethora of geopolitical flashpoints, and a string of economic releases that have fallen short of expectations. But gold has not been the shiniest precious metal this year; back in January, palladium became the most expensive precious metal for the first time since 2002, and by July 8, 2019, it had reached USD 1,542 per troy ounce, a premium of almost USD 150 to gold. When compared to its sister metal, platinum, the performance of palladium has also been impressive, with the platinum/palladium ratio more than halving since the beginning of 2017.

Drivers of performance in the palladium market were a mix of broader, macro demand trends and commodity-specific supply constraints.

Approximately 80%  of palladium demand comes from the automotive industry. Its other uses include electronics, dentistry, and jewelry. As regulations on emissions have tightened, demand for palladium to be used in the catalytic converters of gasoline-powered vehicles has risen. Gasoline vehicles have also become more popular in the wake of a number well-publicized diesel emissions scandals (diesel-powered cars use platinum in their catalytic converters).

Palladium’s outperformance relative to platinum has rightly raised the question of substitution. While it may be theoretically possible for carmakers to switch from palladium to platinum, further technical advances and a reasonable lead time are likely required. It is also worth noting that even with a rally in price, the cost contribution of palladium in car manufacturing is low and may not warrant significant research and development resources, especially when the future of passenger travel may not revolve around the combustion engine.

Electric vehicles do not burn fuel and hence do not require catalytic converters; however, it is not clear how quickly the mass adoption of electric vehicle technology will occur and hence how long it will take for palladium’s largest end market to shrink and eventually disappear.

Palladium is a by-product of platinum and nickel mining and is primarily mined in South Africa and Russia, and both countries face a myriad of investment and production challenges. Palladium prices spiked in March 2019 when Russia’s Ministry of Industry and Trade announced it was considering a temporary ban on the export of precious metal scrap and tailings, while in South Africa, the world’s largest platinum miners are about to embark on a series of wage negotiations with unions, which in the past have led to lengthy mine strikes.

As a by-product, it is not just the prospects of the palladium price that are taken into consideration when a miner makes a short-term capital expenditure or longer-term investment decision.

One area where supply is expected to increase over the coming years is the secondary scrap market. As more and more end-of-life vehicles contain a significant amount of palladium in their auto catalysts, the level and sophistication of recycling will likely increase.

The S&P GSCI Palladium is up 32.8% YTD, making it one of the best-performing individual commodities during the first half of 2019. Its performance in the second half of the year and beyond will depend equally on the ongoing push for lower car emissions and the supply challenges of not being the primary product mined.

The posts on this blog are opinions, not advice. Please read our Disclaimers.

Using Credit Ratios to Build Defensive Corporate Bond Portfolios

Contributor Image
Hong Xie

Former Senior Director, Global Research & Design

S&P Dow Jones Indices

For corporate bond managers, credit analysis is a key step in the investment process, one that lays the foundation for their credit outlook and investment strategies. Credit analysis assesses bond issuers’ creditworthiness and evaluates their ability to make timely interest and principal payments. Credit analysis is critical in helping bond managers assess the state of the credit cycle we are in, select bonds of healthy credit quality, and avoid names that could potentially suffer large principal loss. The analysis includes qualitative and quantitative components. On the quantitative side, credit ratios that measure leverage, interest coverage, liquidity, and profitability allow for the evaluation of a bond issuer’s financial risk profile.

Can we incorporate credit analysis into a rules-based methodology to capture some of the alpha and/or mitigate credit risk generated by active portfolio management? Credit ratio analysis, being quantitative, offers such an opportunity. To do so, we propose a rules-based model that uses credit ratios to screen out the least creditworthy issuers, thereby constructing a corporate bond portfolio with strong credit quality. We acknowledge that ratio analysis is only one part of credit analysis, and though necessary, it is not sufficient to assess an issuer’s creditworthiness. Therefore, instead of actively selecting companies with healthy ratios, we seek to use credit ratios to screen out companies at the bottom of the ranks, indicating financial stress.

The methodology involves two steps. First, we construct a representative investable universe from the broad investment-grade and high-yield corporate bond universe, respectively, by applying criteria on bond size (minimum size of USD 750 million for investment grade and USD 400 million for high yield), maturity (2 years-10.5 years), and spread duration (greater than or equal to 1). In line with the objective of constructing a quality credit portfolio for the high-yield universe, we exclude bonds with a credit rating below “B-.” Second, we group bond issuers by sector (banks, non-bank financials, and non-financial corporates), and use a set of sector-specific credit ratios on leverage, interest coverage, liquidity, and profitability to rank issuers within sectors (see Exhibit 1).

For the applicable ratio within each sector, we calculate a trimmed z-score for every issuer and then standardize the scores within the sector. We rank issuers by the average of the standardized z-scores within their respective sector. The bottom 20% of issuers in each sector are then screened out. The remaining issuers are equally weighted, and bonds issued by the same issuer are equally weighted in the portfolio. The portfolio rebalances quarterly at the end of February, May, August, and November each year.

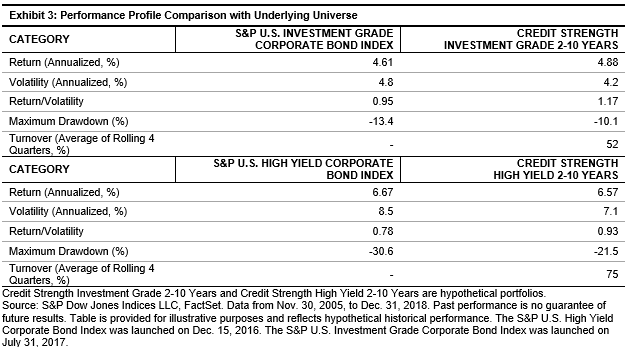
Exhibits 2 and 3 compare the back-tested performance of the credit strength portfolios with the underlying broad market indices. For investment-grade and high-yield bonds, credit strength portfolios reduced return volatility and improved risk-adjusted returns. The maximum drawdown was lower than the underlying universes during market downturns.

The back test shows that incorporating credit ratio analysis in a rules-based portfolio construction process resulted in potentially more desirable risk/return characteristics for investment-grade and high-yield corporate bonds. In our next blog, we will further explore the benefits of downside protection and sector diversification that the credit strength strategy offers.

The posts on this blog are opinions, not advice. Please read our Disclaimers.

The Importance of Being Large-Cap

Contributor Image
Anu Ganti

U.S. Head of Index Investment Strategy

S&P Dow Jones Indices

The performance of U.S. equity factors during Q2 was lackluster, with most underperforming the S&P 500, as seen in Exhibit 1.  While Minimum Volatility and Low Volatility were notable exceptions, Value, Quality, High Beta, and Momentum all lagged the benchmark – in large part because of their tilt toward smaller companies.  Since most factor indices are not cap-weighted, their out- or under-performance tends to parallel that of the equal-weighted 500.

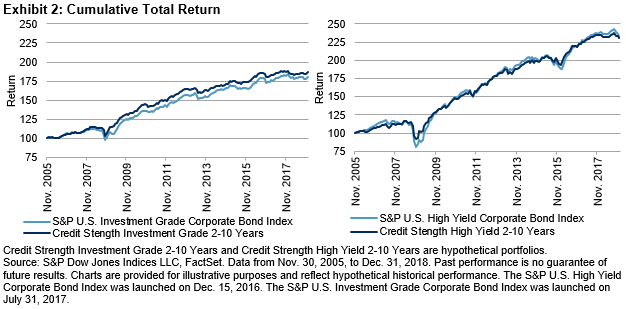
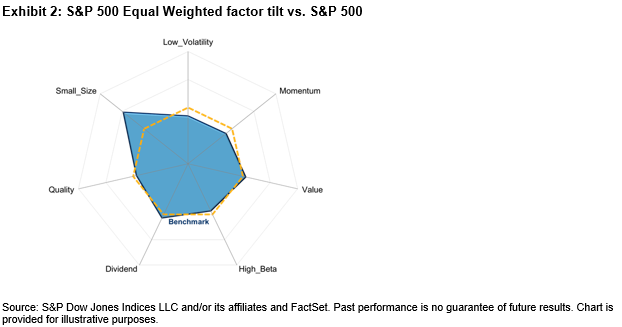
  Equal Weight is a particularly good illustration of the small-size effect, since it holds the same stocks as the cap-weighted S&P 500.  Exhibit 2’s factor exposure chart makes Equal Weight’s small cap tilt clear.  Given the outperformance of larger-cap stocks during the quarter, Equal Weight performance was understandably disadvantaged.

Exhibit 3 demonstrates that larger-cap stocks dominated within most sectors of the S&P 500, with a particularly noticeable effect in the Consumer Discretionary and Info Tech sectors.  Seven out of eleven equal weight sectors underperformed their cap-weighted counterparts.

The S&P 500 Pure Value Index provides a less direct example of the impact of large-cap performance. The key driver of Pure Value’s underperformance last quarter was stock selection, again primarily in the Info Tech and Consumer Discretionary sectors.

Active managers are not immune to these effects.  Our SPIVA database shows that active management tends to be particularly challenged in periods when the largest stocks outperform, and when Low Volatility outperforms.  If I were a betting woman, I would not bet on active manager outperformance when our next SPIVA report appears.

The posts on this blog are opinions, not advice. Please read our Disclaimers.