The S&P China 500 declined 2.8% in Q2 2019, as the U.S.-China trade tensions and threat of company sanctions weighed on returns, even as expectations for eased tensions improved. The decline followed the 23.6% Q1 2019 surge in the index, ultimately leading to overall healthy gains of 20.2% YTD.
Chinese stocks generally lagged global benchmarks in the quarter, as the majority of global country returns were positive. Chinese offshore stocks slightly outperformed onshore listings, as the S&P China BMI fell a lesser 3.3% compared with the S&P China A BMI’s 5.8% decline. As expected, the S&P China 500 posted average performance relative to most of the major Chinese equity benchmarks QTD and YTD, given its diversified composition across all Chinese share classes and sectors.
Most Sectors Declined in Q2 2019
Of the 11 sectors, 2 overcame the overall lower market performance for the quarter, as Consumer Staples (10.6%) and Financials (3.3%) gained, while Information Technology (-10.0%) fell the most, followed closely by Health Care (-9.7%). Positive YTD returns for each sector were a reflection of the outsized gains achieved by the majority of sectors in Q1 2019. YTD gains were led by the consumer sectors, as Consumer Staples (56.4%) gained the most—driven by the outsized 66.7% return of Kweichow Moutai—followed by Consumer Discretionary (27.6%).
 Financials—representing the largest sector of the index by weight—contributed most to the overall performance in Q2, adding 0.9% to the S&P China 500. The Financials sector gains were easily negated however, as the next three sectors by size—Consumer Discretionary, Communication Services, and Industrials each contributed -0.6%, -0.8%, and -0.8%, respectively, representing over 80% of index performance during the quarter.
Valuation Metrics Were Stable in Q2, in Line with Trailing Averages
The S&P China 500’s trailing price/earnings ratio (P/E) rose slightly in Q2, increasing to 14.4x as of June 28, 2019, from 14.0x in March 2019, nearing the 10-year average P/E of 14.7x, while representing a premium to the one-year moving average P/E of 13.1x. Meanwhile, the index’s forward P/E reflected lower prices over the quarter, falling somewhat to 12.2x as of the quarter’s end.

The S&P China 500’s valuations remained in range of broader emerging market indices, as the S&P Emerging BMI’s trailing and forward P/E ratios stood at 14.3x and 12.7x, respectively. The S&P China 500’s dividend yield, meanwhile, increased from 2.15% to 2.32% for the quarter.
The posts on this blog are opinions, not advice. Please read our Disclaimers.
 We also studied the distribution of fund returns and calculated their mean, standard deviation, and skew (see Exhibit 2). The study compared the fund returns data distribution with a hypothetical normal curve constructed with the same mean and standard deviation. Again, we considered the large-cap category and mid-/small-cap category for this analysis.


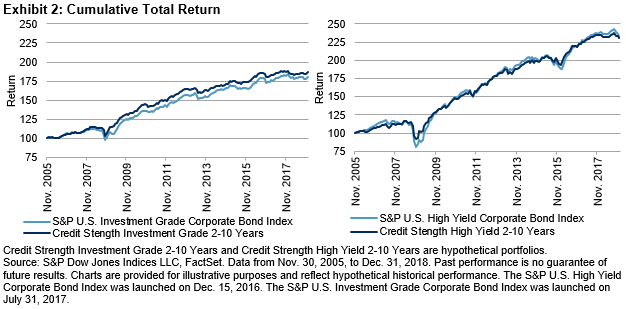
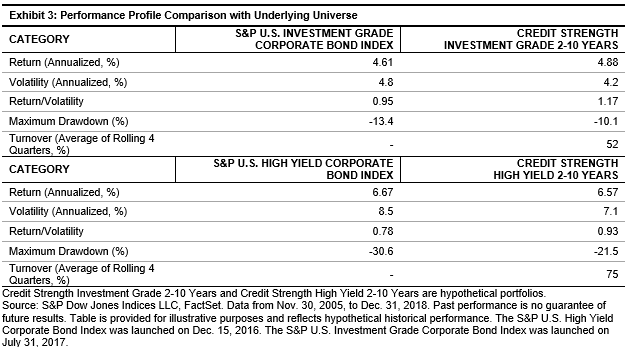
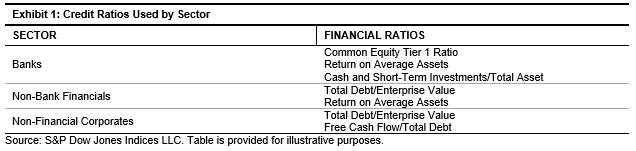 Exhibits 2 and 3 compare the back-tested performance of the credit strength portfolios with the underlying broad market indices. For investment-grade and high-yield bonds, credit strength portfolios reduced return volatility and improved risk-adjusted returns. The maximum drawdown was lower than the underlying universes during market downturns.