Get Indexology® Blog updates via email.

In This List

Risk and Reward – The Advantage of Passive Investment

Unreliable Investment Strategies

Examining Dividend Payers in Colombia

Introducing the S&P/ASX 200 ESG Index: Mainstreaming ESG in the Australian Equities Market (Part 1)

Commodities Markets Can Provide Valuable Insights into the State of the Global Economy

Risk and Reward – The Advantage of Passive Investment

Contributor Image
Koel Ghosh

Former Head of South Asia

S&P Dow Jones Indices

Passive investment is emerging as the more viable and favorable option over active investing. Recommendations for passive investing are supported by statistics. The S&P Dow Jones Indices SPIVA® Around the World Report for year-end 2018 (see Exhibit 1) highlights the trend of benchmark indices beating active funds.

Exhibit 1: SPIVA Year-End 2018 Results

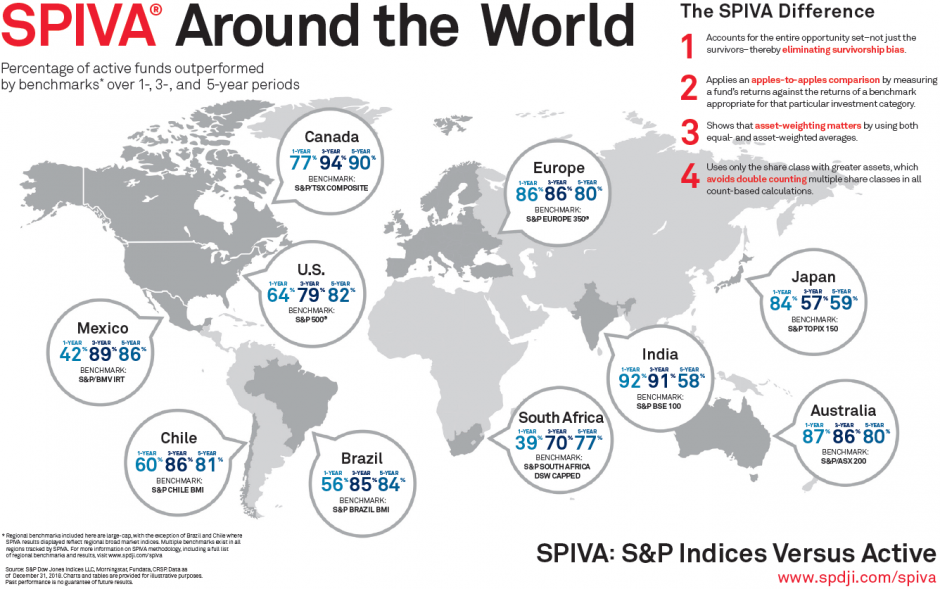
Source: S&P Dow Indices LLC. Data as of Dec. 31, 2018. Past performance is no guarantee of future results. Chart is provided for illustrative purposes.

In India’s significant growth economy, with lower inflation, higher GDP, and a robust financial market, there is recognition that the number of large-cap active funds underperforming their benchmark index is growing. The SPIVA India Year-End 2018 Scorecard revealed that 92% of large-cap funds underperformed the S&P BSE 100 over the 1-year period, 91% underperformed over the 3-year period, and over 50% underperformed over both the 5- and 10-year periods. The challenge for active fund managers to deliver superior returns is on the rise.

Exhibit 2: Percentage of Funds Outperformed by the Index
FUND CATEGORY COMPARISON INDEX 1-YEAR (%) 3-YEAR (%) 5-YEAR (%) 10-YEAR (%)
Indian Equity Large-Cap S&P BSE 100 91.94 90.59 57.55 64.23
Indian ELSS S&P BSE 200 95.45 88.10 40.54 51.52
Indian Equity Mid-/Small-Cap S&P BSE 400 MidSmallCap Index 25.58 56.52 39.68 55.26
Indian Government Bond S&P BSE India Government Bond Index 81.58 71.43 88.00 96.43
Indian Composite Bond S&P BSE India Bond Index 94.44 90.97 96.64 83.33

Source: S&P Dow Jones Indices LLC, Morningstar, and Association of Mutual Funds in India.  Data as of Dec. 31, 2018.  Past performance is no guarantee of future results.  Table is provided for illustrative purposes.

Investors are adopting new dynamic approaches to portfolio management in order to align themselves with targeted portfolio goals. Passive investment objectives are driven by strategy and risk/return profiles.

The passive strategies to select from are manifold: value, growth, fundamental, technical, dividend, indexing, tactical, core, satellite, etc. Asset allocation in the strategy seeks to balance risk and reward by assigning the ideal weights of assets in the portfolio to meet the requirement of the end objective. Strategies vary along a spectrum, from aggressive to conservative.

The selection made on the risk/reward spectrum determines the strategy. Reward, or return, is the change in the value of the investment measured in percentage or in absolute terms like appreciation in stock price or receipt of dividends. Risk is measured by standard deviation, which expresses the volatility of the stock or portfolio by variance from the average. If an investment portfolio has an average expected return of 12% with standard deviation at 5%, the range of returns is expected to be between 7% and 17%.

Modern Portfolio Theory (MPT) is a preferred strategic tool that uses diversification to select a group of assets that offer maximum return for a given level of risk. Harry M. Markowitz in 1952 famously explained the relationship of risk and reward through his article “Portfolio Selection” in the Journal of Finance. He became the pioneer of MPT, also referred to as the Markowitz model.

MPT assumes that investors are generally rational and risk averse. The time horizons for risk and return are the same. The views on risk measurement are identical for all investors and they control risk by diversifying their holdings. The investor prefers to either maximize his return for minimum risk or maximize his portfolio return for a given level of risk.

The theory compares two portfolios with the same return expectation, but one has lower risk than the other. MPT shows that the preference is for the portfolio with lower risk. MPT also clarifies that diversification reduces the portfolio risk. MPT supports the case for the passive investing. This style inherently provides a diverse basket of stocks, avoiding concentration risk and offering returns at the chosen risk level.

Standard deviation typically is used to help evaluate investment risk options. If an index offers a lower standard deviation than an active strategy, but with a comparable average return, the choice of preferable investment option should be easy.

A range of indices offer varied strategies across geographies, asset classes, themes, and factors. Index methodologies are transparent and rules based, staying true to style, unlike active management, which can use discretion in striving to achieve objectives. Passive investing is also generally lower in cost, owing to lower fund management fees and ease of trading, as the index constituents trade on the stock exchange like regular equity stocks.

The Indian passive investment industry is gaining strength with over USD 16 billion in assets. Core satellite strategy can facilitate the co-existence of both active and passive styles to meet portfolio goals.

The posts on this blog are opinions, not advice. Please read our Disclaimers.

Unreliable Investment Strategies

Contributor Image
James Garcelon

Executive Vice-President and Portfolio Manager

Shaunessy Investment Council

S&P Dow Jones Indices produces a semi-annual report comparing the performance of active managers to their target indices or benchmarks. The report is referred to as the SPIVA Scorecard (SPIVA standing for S&P Indices Versus Active Managers).  So, what does the SPIVA Scorecard tell us about performance?  As illustrated in the table above, for any regional equity class and over any timeframe, it tells us that the overwhelming majority of Canadian active managers fail to beat their benchmarks.

This underperformance can be attributed to two main factors: 1) information efficiency and 2) high portfolio management fees. Historically, “stock pickers” were often able to beat their target indices.  This was accomplished through rigorous analysis of privileged financial information and interviews with senior management.  However, he advent of the Internet and new regulations with respect to selective disclosure has levelled the playing field.  Today critical corporate information is readily available to all investors without privilege and at little expense.  As a result, market pricing has become “efficient”.  There is very little that an active manager can determine about the investment prospects for a large cap stock that the market doesn’t already know. At the same time, active managers typically charge investment management fees in the 1% range.  Portfolio turnover is often 50% to 100% or more, in any given year, further raising investment costs and eating into overall portfolio returns.

The end result, as illustrated in the performance data, is that active management of large cap liquid equities is no longer effective.

The posts on this blog are opinions, not advice. Please read our Disclaimers.

Examining Dividend Payers in Colombia

Contributor Image
Cristopher Anguiano

Senior Analyst, U.S. Equity Indices

S&P Dow Jones Indices

While substantial literature exists on dividend investing in developed markets, there is little research on emerging market dividend strategies, in particular for Latin America. S&P Dow Jones Indices surveyed the emerging market dividend payers in 2014 and found that Latin America constituted about 19% of the total global dividend payers.[1] As such, Latin American markets are capable of supporting dividend-based strategies.

In countries like Brazil, Mexico, Chile, and Peru, benchmark providers already offer passive dividend indices as a way to measure performance and provide exposure to dividend-paying stocks. We now expand the investment concept to the Colombian market.

As a starting point, we analyzed the historical dividend payers using the S&P Colombia BMI as the underlying universe, based on 10 years of dividend payment history. We found that on average, 92% of the constituents paid dividends at least once during the trailing calendar year, translating to roughly 97% of the index market cap (see Exhibit 1).

When we looked at the total amount of dividends paid by GICS® sectors (see Exhibit 2), Financials was the largest sector by absolute amount of dividends paid. This was not surprising, as the sector represented 48% of the universe’s floating market cap, on average.

The average dividend yield in Colombia over the trailing 10-year horizon was 2.84%,[2] and the top three dividend yield contributing sectors were Financials (1.4%), Energy (0.7%), and Utilities (0.2%, see Exhibit 3). While Financials had the biggest outsize contribution to yield in the past four years, its contribution actually varied when we went back further in history. Furthermore, we found that Energy used to contribute much more in previous years (2009-2014) compared with recent periods (2016-2018).

When we looked at the historical average number of dividend paying companies by sector, we saw that sectors such as Energy and Communication Services had only one security (see Exhibit 4). The Energy sector in particular raised concentration issues, as its sole constituent had high average dividend yield (5.8%).

With 16 companies paying dividends in 2018, dividend-based strategies in Colombia are possible. However, any construction of such strategies would need to consider potential single-stock and sector concentration issues.

[1]   https://spindices.com/documents/research/research-a-field-guide-to-emerging-market-dividends.pdf

[2]   The average dividend yield is calculated as a weighted average of the index weight and one-year trailing dividend yield.

The posts on this blog are opinions, not advice. Please read our Disclaimers.

Introducing the S&P/ASX 200 ESG Index: Mainstreaming ESG in the Australian Equities Market (Part 1)

Contributor Image
Narottama Bowden

Director, Sustainability Indices Product Management

S&P Dow Jones Indices


The S&P/ASX Australian Index Series has played a significant role in characterizing the Australian equity market performance since its inception in April 2000. Since then, the S&P/ASX 200 has served as the foundation for benchmarks and index-based investing strategies from sectors to quality, value, and momentum factor approaches.

Following the launch of the S&P 500® ESG Index, which uses the new S&P DJI ESG Scores,[1] S&P Dow Jones Indices is proud to announce the launch of the S&P/ASX 200 ESG Index.

In this blog, we will focus on the role the S&P/ASX 200 ESG Index provides as the ESG alternative to mainstream listed equities investing in the Australian market. Using the new S&P DJI ESG Scores and other ESG data to define the index’s eligible universe, the S&P/ASX 200 ESG Index targets 75% of the market capitalization of each GICS® industry group in the S&P/ASX 200. The outcome is to provide an improved index ESG score relative to the benchmark, while providing similar risk and returns, allowing investors to easily put their investment beliefs into action.

The S&P ESG Indices target an improved ESG index profile by allocating to the best 75% of the GICS industry group market capitalization in each benchmark’s eligible universe by ESG score rank. The index’s eligible universe is defined as all benchmark constituents after the removal of companies:

  • with specific involvement in the production or sales of tobacco or controversial weapons or low levels of compliance with the principles of the UN Global Compact or
  • in the lowest 25% of S&P DJI ESG scores among their global GICS industry group peers.[2]

The remaining constituents find themselves market-capitalization-weighted in an index that has historically closely tracked its benchmark, while yielding an improved ESG profile. These indices are designed for investors wishing to integrate ESG factors into their investments without straying far from the benchmark’s risk and return profiles (see Exhibit 2), making them an appealing alternative to core domestic and global allocations.

Additional Resources on the S&P ESG Index Series

[1]   The S&P DJI ESG Scores are based on data gathered by SAM, a division of RobecoSAM, through SAM’s Corporate Sustainability Assessment (CSA).

[2]   The index also accounts for ESG controversies that arise in its companies via SAM’s Media and Stakeholder Analysis (MSA), which continually monitors media for potential ESG-related events that could challenge the ESG scores SAM had assigned to companies.

The posts on this blog are opinions, not advice. Please read our Disclaimers.

Commodities Markets Can Provide Valuable Insights into the State of the Global Economy

Contributor Image
Fiona Boal

Managing Director, Global Head of Equities

S&P Dow Jones Indices

Notwithstanding the recent correction associated with renewed trade tensions between the U.S. and China, a strong start to the year for global equity and commodities markets suggests a strong macroeconomic backdrop and a high risk appetite among investors. However, when drilling down into the performance of individual commodities sectors, it is clear that the situation is much more nuanced.

The global commodities market has been dominated by the strength of the petroleum complex so far this year; the intensity of oil supply disruptions has largely overwhelmed middling oil demand and the seemingly perpetual expansion of U.S. oil production, pushing Brent oil prices back up toward USD 75/barrel, albeit briefly. Oil supply constraints have varied from voluntary OPEC production cuts, to rising tensions among various actors in the Middle East, to U.S. sanctions on Venezuela and Iran. While additional supply disruptions are always a risk in the oil market, it is becoming more difficult to see where new disruptions may occur, and fading economic growth prospects in emerging markets as well as the trade conflict between the U.S and China could put increasing pressure on oil consumption growth and energy prices.

Meanwhile, the recent retracement in industrial metals prices reflects the rekindling of the trade war between the U.S. and China. Metals such as aluminium, nickel, and copper are used extensively in the production of goods targeted by U.S. tariffs, such as electronics. More broadly, higher tariffs also add to the existing headwinds facing the Chinese economy, although it is important to remember that Chinese authorities have the capacity to initiate significant economic stimulus should they deem the impact of the trade war too onerous for specific industries or too detrimental to the prospects for broad economic growth.

While investor and central bank interest in gold remains well above that of previous years, the performance of the gold market has been meek, which is rather at odds with the more cautious view of the world economy presented by recent weakness in the oil and metals markets. That said, there are growing signals coming from various central banks that monetary policy may become more accommodative in the second half of the year in response to flattering prospects for global economic growth, which is likely to support gold prices.

The agriculture sector has been a drain on the performance of the overall commodities market during the first five months of 2019. Agriculture markets are not generally dependent on the macroeconomic environment, but a number of agricultural commodities, such as soybeans, have also been drawn into the U.S.-China trade fracas. The spread of African swine fever, which will cut demand for pig feed, and bumper harvests in North and South America have also contributed to soybean prices falling to a post-financial crisis low.

The latter part of the global economic cycle is typically characterized by the outperformance of industrial commodities, namely energy and industrial metals. While commodities are not anticipatory assets, they can provide a useful insight into current macroeconomic conditions on top of any commodities-specific supply and demand dynamic. It is imperative that investors take stock of the myriad of indicators presented by commodities markets, especially given growing economic and geopolitical turbulence.

The posts on this blog are opinions, not advice. Please read our Disclaimers.