How much should a portfolio manager be willing to pay for research? This is a question any manager has to answer, but it has recently become more pertinent as newly imposed European rules require the costs of investment research to be unbundled from trading. Here is a brief overview of a stylized framework for estimating relative research values across markets and constituents. You can find the full version in our newly-published paper.
If you could subscribe to a series of signals recommending purchase or sale of securities in two different markets, and both sets of signals were equally accurate, which one should you pick? Since even perfect foresight will provide no value if there is no difference in performance between the relative winners and losers, measuring the dispersion for each market would be a helpful step. The greater the dispersion, the greater the potential rewards to correctly picking the best-performing constituent(s) in that market.
Exhibit 1 shows that correctly picking the best-performing U.S. small-cap stock would have been better rewarded, on average, than selecting the best performer in the S&P 500; the average monthly dispersion of the former over the last 10 years is far higher than that of the latter. Does that mean the value of research covering S&P 600 stocks is higher than for S&P 500 members? Not necessarily – we need to account for capacity.
Exhibit 1: Average Dispersion of Various Markets and Segments

Source: The Value of Research: Skill, Capacity, and Opportunity. Past performance is no guarantee of future results. Chart is provided for illustrative purposes.
An investor’s ability to take active positions in each index constituent is related to that constituent’s market capitalization; there is more capacity to maintain an active position in Apple, with its $1 trillion market capitalization, compared to a smaller company. Exhibit 2 shows that there has typically been a trade-off between dispersion and the size of constituents in various markets. While the expected percentage reward from successful active bets might be greater among small-cap U.S. stocks, the size of an investor’s position might have to be smaller.
Exhibit 2: Higher dispersion has been associated with smaller markets
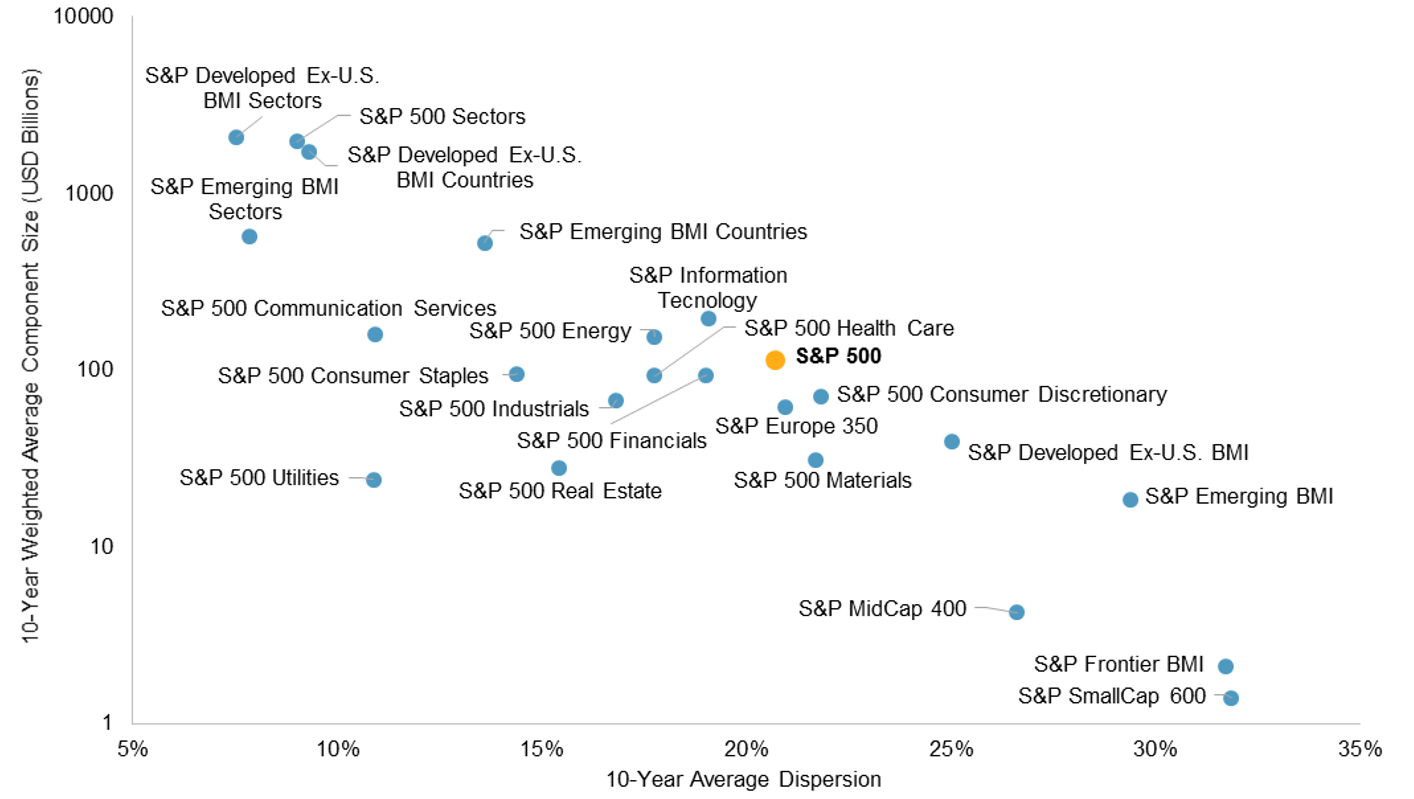
Source: The Value of Research: Skill, Capacity, and Opportunity. Past performance is no guarantee of future results. Chart is provided for illustrative purposes.
We propose capacity-adjusted dispersion as an intuitive measure for estimating relative research values. It is computed by multiplying each market’s dispersion and average constituent market capitalization and may be understood as the potential scale of the available bets multiplied by the potential magnitude of the returns to successful bets. While absolute measures are useful, Exhibit 3 displays the ratio between the capacity-adjusted dispersion of various markets and the equivalent measure applied to S&P 500 stocks.
The estimated value of research covering S&P 500 sectors is far larger than research covering S&P 600 stocks; the larger capacity of the sectors outweighs their lower dispersion. As a result, by combining capacity and dispersion in a single measure, this stylized framework allows us to compare the value of research across different markets. Our findings suggest that, other things equal, insight into markets with more capacity is especially valuable. This supports a top-down, rather than stock-centric, approach to asset allocation.
Exhibit 3: Capacity-Adjusted Dispersion in Various Markets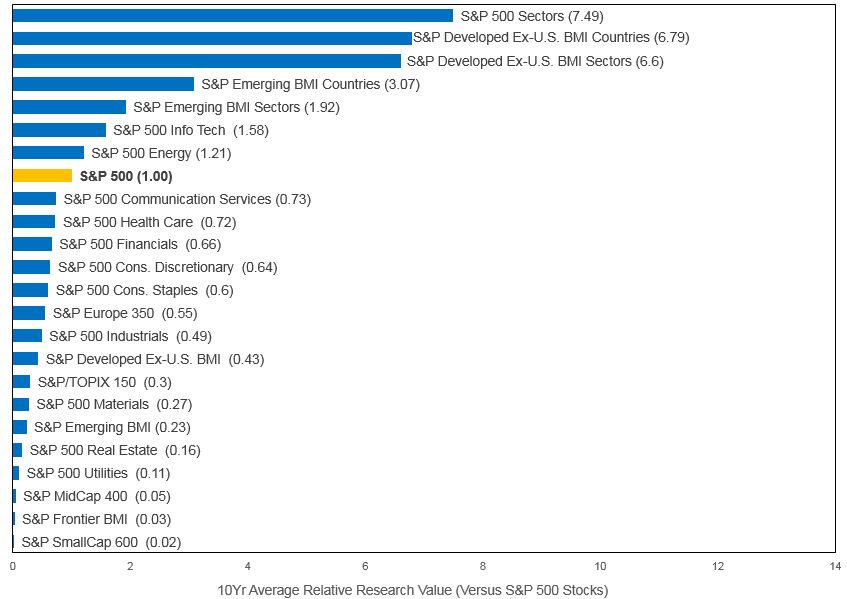 Source: The Value of Research: Skill, Capacity, and Opportunity. Past performance is no guarantee of future results. Chart is provided for illustrative purposes.
The posts on this blog are opinions, not advice. Please read our Disclaimers.