Carbon emission awareness has been gaining greater prominence on many market participants’ radar as they continue to seek and demand carbon emission information and related risks for companies associated with climate change. To address this need, the Financial Stability Board taskforce recently published a series of recommendations on how companies should report climate-related risks and opportunities. The guidelines have already been endorsed by a host of blue-chip firms in addition to the Carbon Disclosure Project.
Index providers are recognizing the need for increased environmental information disclosure and are working to make carbon emission statistics readily available for any benchmark, not just for those indices that are associated with the specific purpose of carbon efficiency. The S&P Dow Jones Indices Carbon Emitter Scorecard that was released in April 2016 took the first step in providing various emission statistics for headline regional indices in addition to detailing sectoral emissions based on GICS® sector classifications.
An area that tends to be overlooked and less explored in regard to carbon data is the carbon footprint of factor indices. This is particularly important in light of increasing adoption of and allocation of capital to smart beta strategies by market participants. For those already implementing factor-based asset allocation and wishing to be aligned with the two-degree investing initiative, it is important to understand a portfolio’s carbon exposure. Therefore, in this blog, we explore the emission statistics for the five major S&P 500® factor indices: the S&P 500 Low Volatility Index, S&P 500 Enhanced Value Index, S&P 500 Quality, S&P 500 Momentum, and S&P 500 Dividend Aristocrats®.
Emissions are typically measured by mass of carbon dioxide equivalent (CO2e), whereby the equivalent is a proxy applied to greenhouse gases other than carbon dioxide and reflects their relative environmental impact. The units of reference are in kilotons of CO2e.[1] Exhibit 1 shows the total direct emissions for each of the S&P 500 Factor Indices referenced previously in addition to the benchmark.
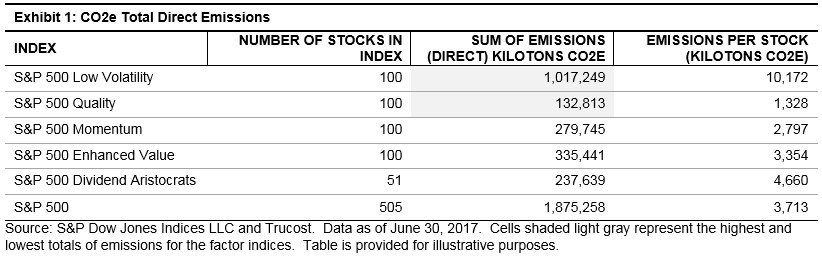
The results highlighted some interesting findings, one of which showed that the low volatility factor generated the highest total in emissions due to its strong utilities sector presence. The S&P 500 Low Volatility Index has 17 utilities companies, generating over 60% of its direct carbon emissions. This finding (that low volatility indices tend to have a high carbon emission bias) presents potential solutions from the index provider perspective and allows them to incorporate a carbon efficiency component to low volatility indices.
Conversely, the quality factor had the lowest carbon emissions. The S&P 500 Quality had zero exposure to utilities and negligible allocation to energy. The quality strategy’s contribution to CO2e emissions stemmed from its high industrials exposure (10% overweight versus the benchmark). Industrials ranked high in the quality index due to the sector’s strong profitability growth as it benefits from the uptick in the business cycle. The industrials component contributed more than 52% of the S&P 500 Quality’s total direct emissions (see Exhibit 2).
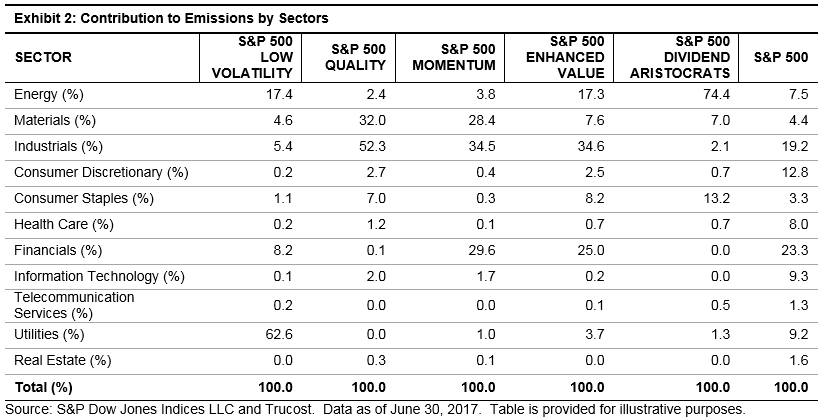
Lastly, the financial sector was the second-highest contributor of CO2e emissions for the enhanced value and momentum strategies, which at first glance, may appear somewhat out of the ordinary. However, Berkshire Hathaway constituted 6.5% of the S&P 500 Momentum and 3.9% of the S&P 500 Enhanced Value Index, ranking as the second and fifth top holding in those respective indices. Its portfolio company, Berkshire Hathaway Energy, generated 99% of the financial sector’s total CO2e emissions in the momentum and enhanced value strategies.
Understanding the carbon exposure of smart beta strategies is important for market participants who are already implementing smart beta strategies and wish to incorporate carbon risk into the investment process. Our analysis shows that factors such as low volatility and value may be predisposed to higher carbon emissions because of their sector compositions.
[1] Emissions data is sourced from Trucost, which provides data on both direct and first-tier indirect emissions on a company-by-company basis; if companies do not report or otherwise make such figures available, Trucost estimates the emissions of each company using a proprietary model. Direct emissions, as the name suggests, encompass emissions of CO2e produced directly by the entity, whereas indirect emissions are those that arise from the entity’s suppliers of materials and equipment, utilities such as electricity, and business travel. The inclusion of indirect emissions is not always preferable, especially in an index, as this may result in double counting. For example, if a utility company and one of its customers were included in the same index, the emissions of the latter would be counted twice.
The posts on this blog are opinions, not advice. Please read our Disclaimers.