Get Indexology® Blog updates via email.

In This List

Gold: Its History and Recent Trends

A Lesson in Last Week's Turmoil

Walgreens case study - S&P Healthcare Claims Indices to better manage expectations

REITs – A Mature Asset Class in the U.S. and Growing Interest Globally

Colombia — Innovation in Indexing

Gold: Its History and Recent Trends

Contributor Image
Utkarsh Agrawal

Associate Director, Global Research & Design

S&P Dow Jones Indices

During festivals such as Diwali, the demand for gold in India increases because it is considered auspicious.  Traditionally, people invested in physical gold bars, coins and jewelry.  However, after the introduction of the gold ETF, the option to invest in gold also became popular.  There was a huge growth in the assets under management for gold ETFs compared with ETFs in other asset classes.

Investors purchased gold as a way to preserve value and hedge against inflation and recession.  Gold was in a bull run until the year 2012, and the average asset under management in gold ETFs peaked at INR 119 billion in Q1 2013, but since then it has declined.

Exhibit 1: Average Assets in Gold ETF’s in India 

Gold 1

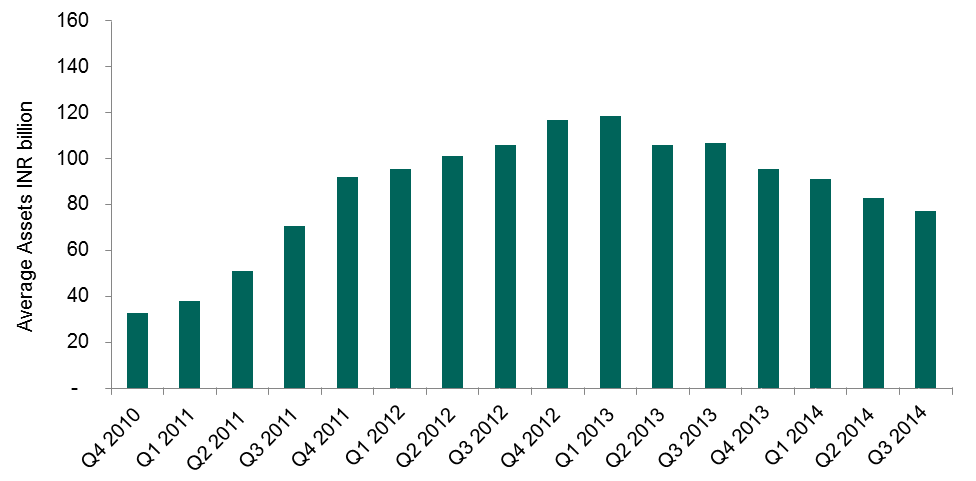
Source: Association of Mutual Funds of India.  Data as of Sept. 30, 2014 

The Federal Reserve introduced tapering after confidence of the sustained improvement in the U.S. economy was restored.  Tapering led to the strengthening of the U.S. dollar, which exerted downward pressure on the price of gold.  The import restrictions in India, the second largest consumer of gold, exacerbated the situation.

The Indian government and the Reserve Bank of India introduced a series of measures in 2013 in an effort to curb the import of gold and improve the current account balance of payments of India.  The introduction of the 80:20 rule, under which 20% of the imports must be re-exported, and an increase in import tariffs has reduced the amount of gold imported, and it has increased gold’s premium in the local market compared with that of the global market.

Looking at Exhibit 2, we can see that the S&P GSCI® Gold TR, which measures the returns accrued from investing in fully collateralized gold futures contracts, has been in a declining trend.  It has lost nearly 8.91% and 9.78% over the one- and three-year periods ending in September 2014, respectively.

There has also been a shift in the sentiment toward investments in equity and bond markets because of higher returns.  These all are included as some of the reasons for the decline in the price of gold after the 11-year bull run.  However, with the ongoing economic crisis in Europe and among the emerging markets, gold may still benefit as a safe haven hedging tool.

Exhibit 2: S&P GSCI Gold TR 

Gold 2

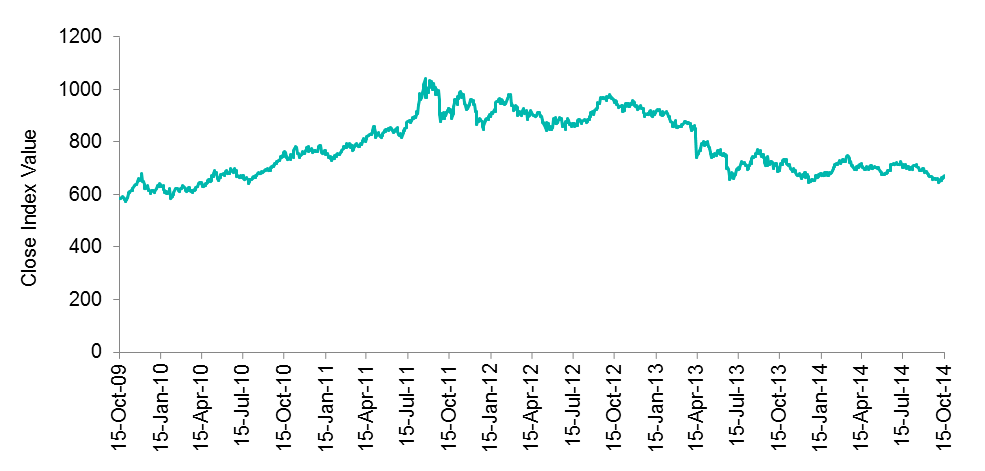
Source: S&P Dow Jones Indices LLC.  Data as of Oct. 15, 2014.  Charts and tables are presented for illustrative purposes.  Past performance is no guarantee of future results.


The posts on this blog are opinions, not advice. Please read our Disclaimers.

A Lesson in Last Week's Turmoil

Contributor Image
David Blitzer

Former Managing Director and Chairman of the Index Committee

S&P Dow Jones Indices

The market action in US stocks and Treasuries last week, especially on Wednesday, may be an experience that many investors would like to forget.  On Wednesday volume in US treasuries set a record as yields collapsed, stocks nose-dived and VIX topped 30 after opening the week at about 20.  As horrifying, or exciting, as it was, there may be lessons buried in the numbers.

Rarely does one specific event cause this kind of market turmoil; rather many sources of investor anxiety crowd together.  Among the protagonists were Ebola fears, slow European economies, weak US retail sales, and the Middle East.  Over-riding all of this was the growing conviction that the markets were surely in a correction, if not something worse, and no one would even guess where the bottom might be. As downward momentum gains strength it persuades investors that they should be getting out.  When that happens, investors want to sell the dogs — their least attractive unwanted and illiquid holdings.   But these are exactly the positions that are hardest sell if there is a market and impossible to unload if the market vanishes into the turmoil.

The response? Investors have no choice but to sell what they can sell, not what they want to sell.  What can they sell in the midst of the storm?  Anything in the deepest markets:  either US stocks or US Treasuries.  Last week the focus of fear was on equities and the answer was selling US stocks.  Hedging also may have been driving the market.  Equity investors who wanted a hedge for down side protection would have chosen the liquidity in S&P 500 futures.  Short futures positions can be read as a sign that stocks will fall further and may add to downward momentum.

While Wednesday’s action in US Treasury notes was more of a buying panic, the week’s events could be a hint of what might happen when the Fed finally does raise interest rates.   Some time, probably next year, the FOMC meeting notes will announce that monetary policy is being tightened and interest rates will rise.  Investors in a rush to sell unwanted bonds will find the only liquid market is 10 year Treasuries; they will be forced to keep junk bonds and sell, or short, treasuries. Others simply looking for a hedge will also short treasuries.  Those illiquid unwanted bonds will then be re-priced at lower levels consistent with the falling prices on over-sold US treasuries.   Fixed income prices could cascade downward.  It has happened before in the early 1990s when the Fed tightened more aggressively than expected and mortgage-backed bond traders got caught in a rush to the exit.

The posts on this blog are opinions, not advice. Please read our Disclaimers.

Walgreens case study - S&P Healthcare Claims Indices to better manage expectations

Contributor Image
Glenn Doody

Vice President, Product Management, Technology Innovation and Specialty Products

S&P Dow Jones Indices

In late August, as reported by the Wall Street Journal, Walgreens announced the departure of their CFO at the end of the current year. This news came after a significant cut in forecasts by $1.1 billion from the original $8.5 billion forecast in fiscal 2016 pharmacy-unit earnings. According to the Wall Street Journal, “Walgreens hadn’t factored in, among other things, a spike in the price of some generic drugs that it sells as part of annual contracts.” This illustrates an opportunity where the S&P Healthcare Claims Indices may have been utilized as a tool to monitor the changing costs of both medical and drugs. As evident in the cost chart below, generic drug costs tend to be quite volatile, with overall costs growing at times in excess of 20%. However, looking at utilization, we can see that growth peaked in January of 2013, and has been declining ever since.

Capture

Capture


Capture

To gain insight on generic drugs, one may look at Unit Cost Indices, which show that while brand name drugs continue to escalate in price steadily over time, the cost of generic drugs on a Unit Cost basis tends to be more volatile, even declining in price at times. Because both the utilization and average cost of generic drugs are driven by factors such as the end of the patent protection period on brand drugs, high volatility is likely to be an inherent characteristic of generic drugs. By utilizing the S&P Healthcare Claims Indices, one may be able to better manage expectations for future changes in healthcare costs by studying recent trends.

The posts on this blog are opinions, not advice. Please read our Disclaimers.

REITs – A Mature Asset Class in the U.S. and Growing Interest Globally

Contributor Image
Michael Orzano

Head of Global Exchanges Product Management

S&P Dow Jones Indices

Over the past two decades, real estate investment trusts (REITs) have emerged as a popular and efficient way for investors of all stripes to access the real estate asset class. Strong long-term total returns, combined with other key investment characteristics such as liquidity, high dividend yields, their potential to increase diversification and to hedge against inflation have contributed to the appeal of REITs.

Source: S&P Dow Jones Indices LLC; Barclays Capital. Data as of Sept. 30, 2014. Returns are based on total return index levels. REITs, Stocks, Bonds and Commodities are represented by the Dow Jones U.S. Select REIT Index, the S&P 500, Barclays Capital U.S. Aggregate Index and the S&P GSCI, respectively. Charts and tables are provided for illustrative purposes. Past performance is no guarantee of future results

REITs were established in the U.S. in the 1960’s and have evolved into a mature asset class here. However, outside of a handful of other early adopters such as Australia and Canada, the REIT structure had not been widely adopted globally until recently. In the past several years, REITs have gained traction globally as more and more countries around the world have enacted legislation authorizing REITs. In 2000, only 6 countries were eligible for SPDJ REIT indices. Today, twenty four are eligible with recent growth concentrated in Europe and Emerging Markets.

Capture

Source: S&P Dow Jones Indices LLC. Data as of Sept. 30, 2014. Charts and tables are provided for illustrative purposes.

Although the U.S. remains by far the world’s largest REIT market by value, it now represents only about half of the global opportunity set for listed real estate securities.

To learn more about the REIT structure, their evolution as an asset class, and their investment characteristics see our paper REITs: Making Property Accessible.

The posts on this blog are opinions, not advice. Please read our Disclaimers.

Colombia — Innovation in Indexing

Contributor Image
Jasmit Bhandal

Index Specialist

Horizons ETFs Management (Canada) Inc.

If the world were a simpler place, we would have one index per market. However, this is far from the case. Markets have multiple indices, and deciding which index provides the best exposure is no easy feat. This is especially true in developing markets like Colombia, where multiple indices are jockeying to be the “market benchmark.”

Looking back at the early days of indexing, the formula for the Dow Jones Industrial Average (DJI) was as simple as aggregating the prices of the largest stocks in the U.S. market and then dividing by the number of stocks. Times have changed. The level of complexity involved with index construction has increased, and thus, determining the choice of benchmark is a challenging task.

Currently, there are various indices representing the local Colombian market such as the COLCAP Index and the S&P Colombia Select. The COLCAP Index is managed by the local equity exchange and was relaunched with new methodology in 2013. The S&P Colombia Select Index is new on the scene and launched earlier this year.

Typically, a traditional market capitalization index with robust liquidity and market cap screens will usually suffice as a market benchmark. Using a GICS® framework for comparison, only 6 of the 10 sectors are reflected in either Colombian index (see Exhibit 1). These indices do not include securities from sectors such as healthcare, consumer discretionary or telecommunications.

This creates potential sector and company risk due to concentration within the index. The S&P Colombia Select Index mitigates some of this risk by placing caps on the stock and sector concentrations. Stocks are limited to a 15% weight in the index, while sectors are capped at 40%. Energy is the sector with the biggest difference in weight between the two indices. The S&P Colombia Select Index has a significantly lower energy weight at 12.13% versus 18.51% for the COLCAP Index.

When constructing an index, there is a tradeoff between representativeness and investability. In markets such as Colombia, this is the single biggest determinant of risk exposure and liquidity of the constituents. The trick is to then construct an index that seeks to measure Colombian equities while also mitigating significant sector and liquidity risks. One of the unique aspects of the S&P Colombia Select Index is its innovative weighting technique, which considers trading volumes in order to improve the liquidity profile of the index. This helps support low-cost replication in a relatively illiquid market.

We are starting to see the evolution of index construction; index providers are recognizing that the key determinants of an index’s effectiveness are controlling risk and efficiently replicating index constituents.

A pure market cap weighting approach can be highly effective in many developed market indices. However in smaller markets, where concentration and liquidity risks are more common problems, it’s imperative that the index take these factors into account.

The above table has applied GICS sector classification to the COLCAP index for illustrative purposes only. The COLCAP index does not use the GICS system. The COLCAP index uses its own proprietary industry classifications for classifying securities. GICS is an industry classification scheme jointly developed and administered by S&P DJI and MSCI.

The posts on this blog are opinions, not advice. Please read our Disclaimers.