At the beginning of this year, we suggested that 2013 might well have been a another tough year for active managers. Judging from the response received at the time, this expectation was somewhat controversial: the more common refrain was to point to falling correlations during 2013 and predict a return to “stock-pickers’ market.” In such an environment, the reasoning goes, it pays to be more active with your investments.
Our regular SPIVA® scorecard regularly reports on the relative performance of active managers, and the full-year 2013 results are in. Last year, roughly 45% of U.S. large-cap funds achieved the distinction of outperforming the S&P 500® – a touch up from the previous year, but still a strong validation for passive investors.

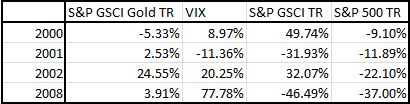
Source: S&P Dow Jones Indices Data for 2007 are to March end; all other years are full calendar years. Charts are provided for illustrative purposes. Past performance is no guarantee of future results.
Moreover, it seems our forecasts regarding 2013 were correct in a second respect. Based on our research on dispersion, we expected to see a relatively narrow spread between the best and the worst managers (again, despite falling correlations). The data show that for large-cap core U.S. equity funds (the subject of our original research), 2013’s interquartile range between the best and worst performers was indeed fairly low, and continues to be well-paralleled by dispersion.
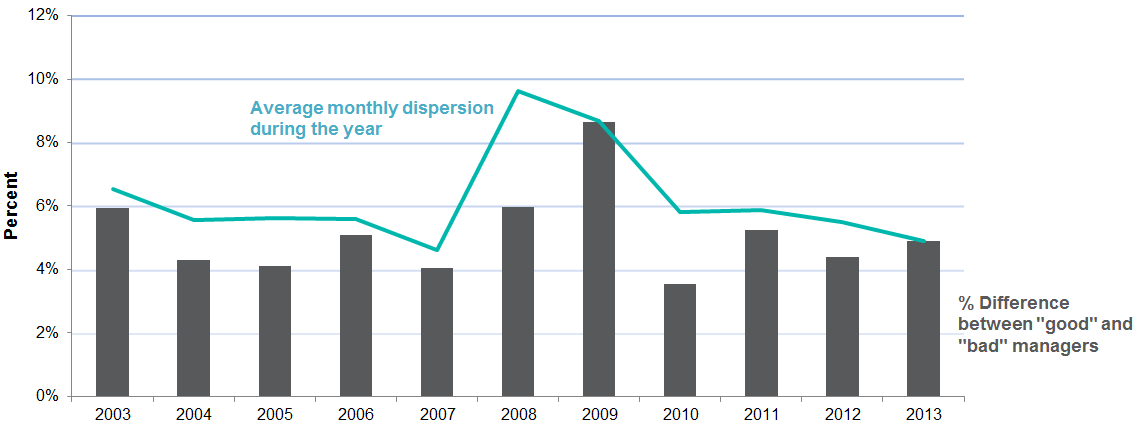
Source: S&P Dow Jones Indices Data for 2007 are to March end; all other years are full calendar years. Charts are provided for illustrative purposes. Past performance is no guarantee of future results.
While it remains unclear whether the choppy markets of 2014 will provide a more conducive environment for active managers, those who wish to leaven their analysis with the latest values of dispersion may be interested in reading our ongoing commentary.
The posts on this blog are opinions, not advice. Please read our Disclaimers.