Get Indexology® Blog updates via email.

In This List

Natural Gas Is Backwardated And The Weather Is Backwards

S&P 500®: A Look Back At A Very Good Year

Indian Fixed Income or Equities: Know your onions!

Investing in Solutions: Leaders in Finance and Climate

National Credit Default Rates Decreased in December 2013 According to the S&P/Experian Consumer Credit Default Indices

Natural Gas Is Backwardated And The Weather Is Backwards

Contributor Image
Jodie Gunzberg

Former Managing Director, Head of U.S. Equities

S&P Dow Jones Indices

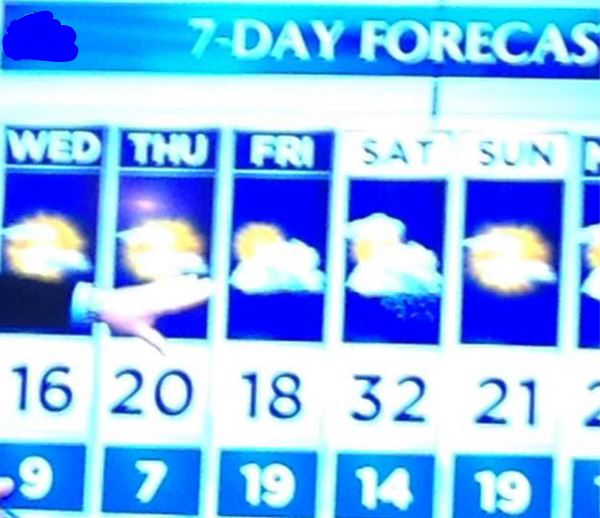
When I see a forecast of freezing weather, unlike most, I don’t think about how I will dress warmly or prepare for the cold.  As a commodity lady, I think about how much the price of natural gas will increase. However when I saw this on TV yesterday, I had more food for thought than just the price of natural gas.  Notice Friday’s high is listed as 18 degrees Fahrenheit (about -8 Celsius) while the low is listed as 19 degrees Fahrenheit (about -7 Celsius).

Wacky Weather

I only chuckled for a moment before thinking about natural gas again.  Natural gas has been the best performing commodity in the S&P GSCI so far in 2014, up 8.6%. It is also in backwardation with the spot only up 7.6%, which is relatively rare. You can see in this chart below that natural gas has been in backwardation in only 13% of months since 1994.  Also, it has only been in backwardation in 10 months within the past 10 years with an average premium of 39 basis points. That is about 60 basis points less than the premium thus far in January 2014.  What is less unusual about the backwardation is its January appearance since backwardation has always happened in extreme cold or heat.

Source: S&P Dow Jones Indices. Data from Jan 1994 to Dec 2013. Past performance is not an indication of future results. This chart reflects hypothetical historical performance. Please see the Performance Disclosure at the end of this document for more information regarding the inherent limitations associated with backtested performance.

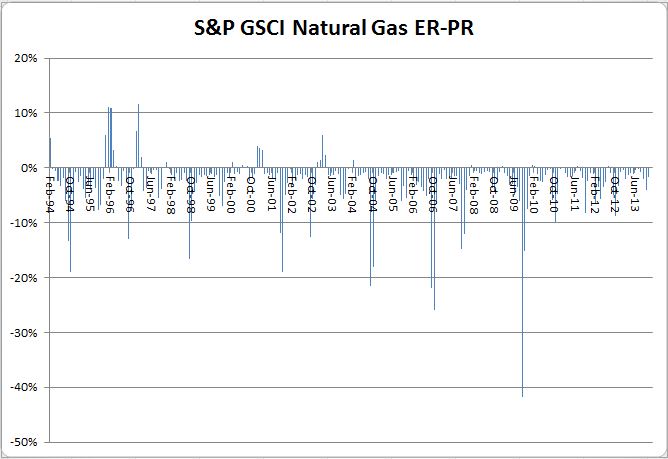
Since 1995, there have been 8 positive January months with an average return of 9.1%.  The highest return in January was in 2007, when the S&P GSCI Natural Gas returned 21.7%.  Although there was a slightly positive return in 2008 of 34 basis points, 2014 has the first significant positive return since 2008, 6 years ago, when the monthly return was 7.9%.  Please see the chart below:

Source: S&P Dow Jones Indices. Data from Jan 1995 to Jan 2014. Past performance is not an indication of future results. This chart reflects hypothetical historical performance. Please see the Performance Disclosure at the end of this document for more information regarding the inherent limitations associated with backtested performance.

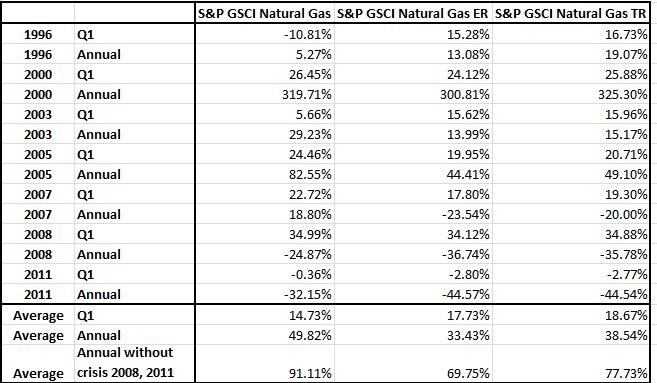
The question is what has happened following a positive January for natural gas?  In years with positive January months, average first quarter returns were 14.7% for the spot index and 18.7% for the total return. Average annual returns were 49.9% for spot natural gas and 38.5% for the total return, but without the crisis years, the average annual return was double.

Please see the table below:

Source: S&P Dow Jones Indices. Data from Jan 1995 to Jan 2014. Past performance is not an indication of future results. This chart reflects hypothetical historical performance. Please see the Performance Disclosure at the end of this document for more information regarding the inherent limitations associated with backtested performance.


The posts on this blog are opinions, not advice. Please read our Disclaimers.

S&P 500®: A Look Back At A Very Good Year

Check out this infographic in our quarterly magazine, INSIGHTS

The posts on this blog are opinions, not advice. Please read our Disclaimers.

Indian Fixed Income or Equities: Know your onions!

Contributor Image
Utkarsh Agrawal

Associate Director, Global Research & Design

S&P Dow Jones Indices

The fixed income market is quintessential for the growth of the economy. They serve as one of the mediums for the government to raise money. In India the fixed income market has been attaining the depth as well as maturity over the years and the government securities play a dominating role.

The on-the-run 10 year fixed interest rate bond issued by the Reserve Bank of India is treated as the benchmark and serves as a reference point for pricing of the other bonds along a yield curve. The S&P BSE India 10 Year Sovereign Bond Index seeks to measure the performance of the benchmark security and can be considered as the bellwether index.

Fixed income market returns in general tend to be less volatile as compared to the equity market returns. This is very well depicted in the performance chart below. We can observe that S&P BSE India 10 Year Sovereign Bond index is less volatile as compared to S&P BSE SENSEX index.

Utkarsh_Know ur Onions_Jan14

Average inflation in India was low during 2003 to 2007 and S&P BSE SENSEX index did well in these years. The S&P BSE India 10 Year Sovereign Bond Index remained mostly stable. In the year 2008, which was marked by recession, the S&P BSE SENSEX index nosedived, whilst the S&P BSE India 10 Year Sovereign Bond Index rose. Since 2009, the S&P BSE SENSEX index has improved significantly and the S&P BSE India 10 Year Sovereign Bond Index has also shown stable growth. The risk percentage and the annualized returns of the S&P BSE India 10 Year Sovereign Bond Index are low vis-à-vis S&P BSE SENSEX Index. The correlation of monthly returns in both the asset classes is very less and it decreases further as the time span increases. Table below summarizes the statistics.Utkarsh_Know ur Onions_Jan14_2

The posts on this blog are opinions, not advice. Please read our Disclaimers.

Investing in Solutions: Leaders in Finance and Climate

Contributor Image
Alka Banerjee

Former Managing Director, Product Management

S&P Dow Jones Indices

This week, I participated in an event at the White House on Women Leaders in Climate Finance and Investment that highlighted the pioneering role women leaders in the finance sector are playing to mainstream climate change into finance and investment decisions.  Women around the world are often the first to feel the effects of climate and at the same time can offer unique perspectives and solutions.

I was privileged to be part of a conversation on “making climate finance work for growth,” where we discussed that a consistent global policy framework on climate change could make implementation of scalable solutions practical and possible. At S&P Dow Jones Indices, we are working to advance these solutions by creating equity indices — tools for investment products like exchange traded funds — which respond to consumer demand for products that help address climate change. We have created specialized indices, such as the global clean energy index, and variations of mainstream indices, such as the S&P U.S. Carbon Efficient index and the S&P/IFCI Emerging Markets Carbon Efficient index that weight companies by their carbon emissions, with higher weights going to lower emitting companies. These indices help investors choose whether to invest in companies with high carbon pollution. Over time, we have seen investor perceptions change from excluding large polluting companies from their portfolios for environmental reasons, to doing so to manage risk, to understanding that companies with progressive environmental standards are poised for more sustainable, long-term growth. We are also seeing some investors seek to completely avoid fossil fuel investment in their portfolios.

The event also included Administration officials such as Presidential advisor John Podesta, Chair of the Council on Environmental Quality Nancy Sutley, Domestic Policy Council Director for Energy and Climate Change  Dan Utech, Ambassador-at-Large for Global Women’s Issues Cathy Russell, and President and CEO of the Overseas Private Investment Corporation Elizabeth Littlefield,  who described  efforts under the President’s Climate Action Plan to make U.S. cities and states more resilient, support good clean energy and clean technology jobs, and help developing countries adapt to climate change and access renewable energy. U.S. Senator Jeanne Shaheen (NH) discussed her energy efficiency legislation, which supports investment in clean energy technologies that help to reduce carbon pollution.

The discussions revealed some key challenges and unique initiatives associated with mainstreaming climate change into finance. For example, Lindene Patton, Chief Climate Product Officer of Zurich Insurance Group, discussed the insurance industry’s role in managing climate risks and a commitment by Zurich to provide climate-smart insurance products and invest up to $1 billion in “green bonds,” which would help address climate change. Nancy Pfund, Founder and Managing Partner of DBL Investors, stated that while many private investments in green energy make good business sense and several have delivered good returns to their investors, the challenge is to attract positive attention from all sectors to the benefits of these options.

The event brought to focus the real desire to make a positive social and environmental impact through investment decisions and showed that women are playing an increasingly crucial role to make this happen.

The posts on this blog are opinions, not advice. Please read our Disclaimers.

National Credit Default Rates Decreased in December 2013 According to the S&P/Experian Consumer Credit Default Indices

Contributor Image
Dave Guarino

Director, Global Index Communications

S&P Dow Jones Indices

S&P Dow Jones Indices released the latest results for the S&P/Experian Consumer Credit Default Indices. Data is through December 2013

The posts on this blog are opinions, not advice. Please read our Disclaimers.