Get Indexology® Blog updates via email.

In This List

Inside the S&P 500: Float adjustment

What Municipalities are Higher Risk?

THE Golden Question?

Does Past Performance Matter?

When Diversification Fails

Inside the S&P 500: Float adjustment

Contributor Image
David Blitzer

Former Managing Director and Chairman of the Index Committee

S&P Dow Jones Indices

Most stock indices where the weight of each stock depends on its market value are “float adjusted” meaning that the index only counts those shares that are available to investors and excludes closely held shares or shares held by governments or other companies.

The S&P 500 moved to float adjustment in in 2004-2005.  Initially many investors expected substantial changes would result.  By most estimates, between 10% and 15% of the stock of each company in the index is held by ETFs or indexed money managed for pensions, endowments or mutual funds.  With a block that large held by index trackers, it would seem that counting only the stock that is readily available to investors and index trackers would matter.  There were two counter arguments raised by some analysts. First, the stocks in the S&P 500 are all liquid. Currently a stock should exhibit at least 100% share turnover in a year when it joins the index; most companies in the index surpass this by a wide margin.  Second, the index has a long-standing requirement that at least 50% of a company’s outstanding stock be part of the public float when it entered the index so low-float companies were excluded.

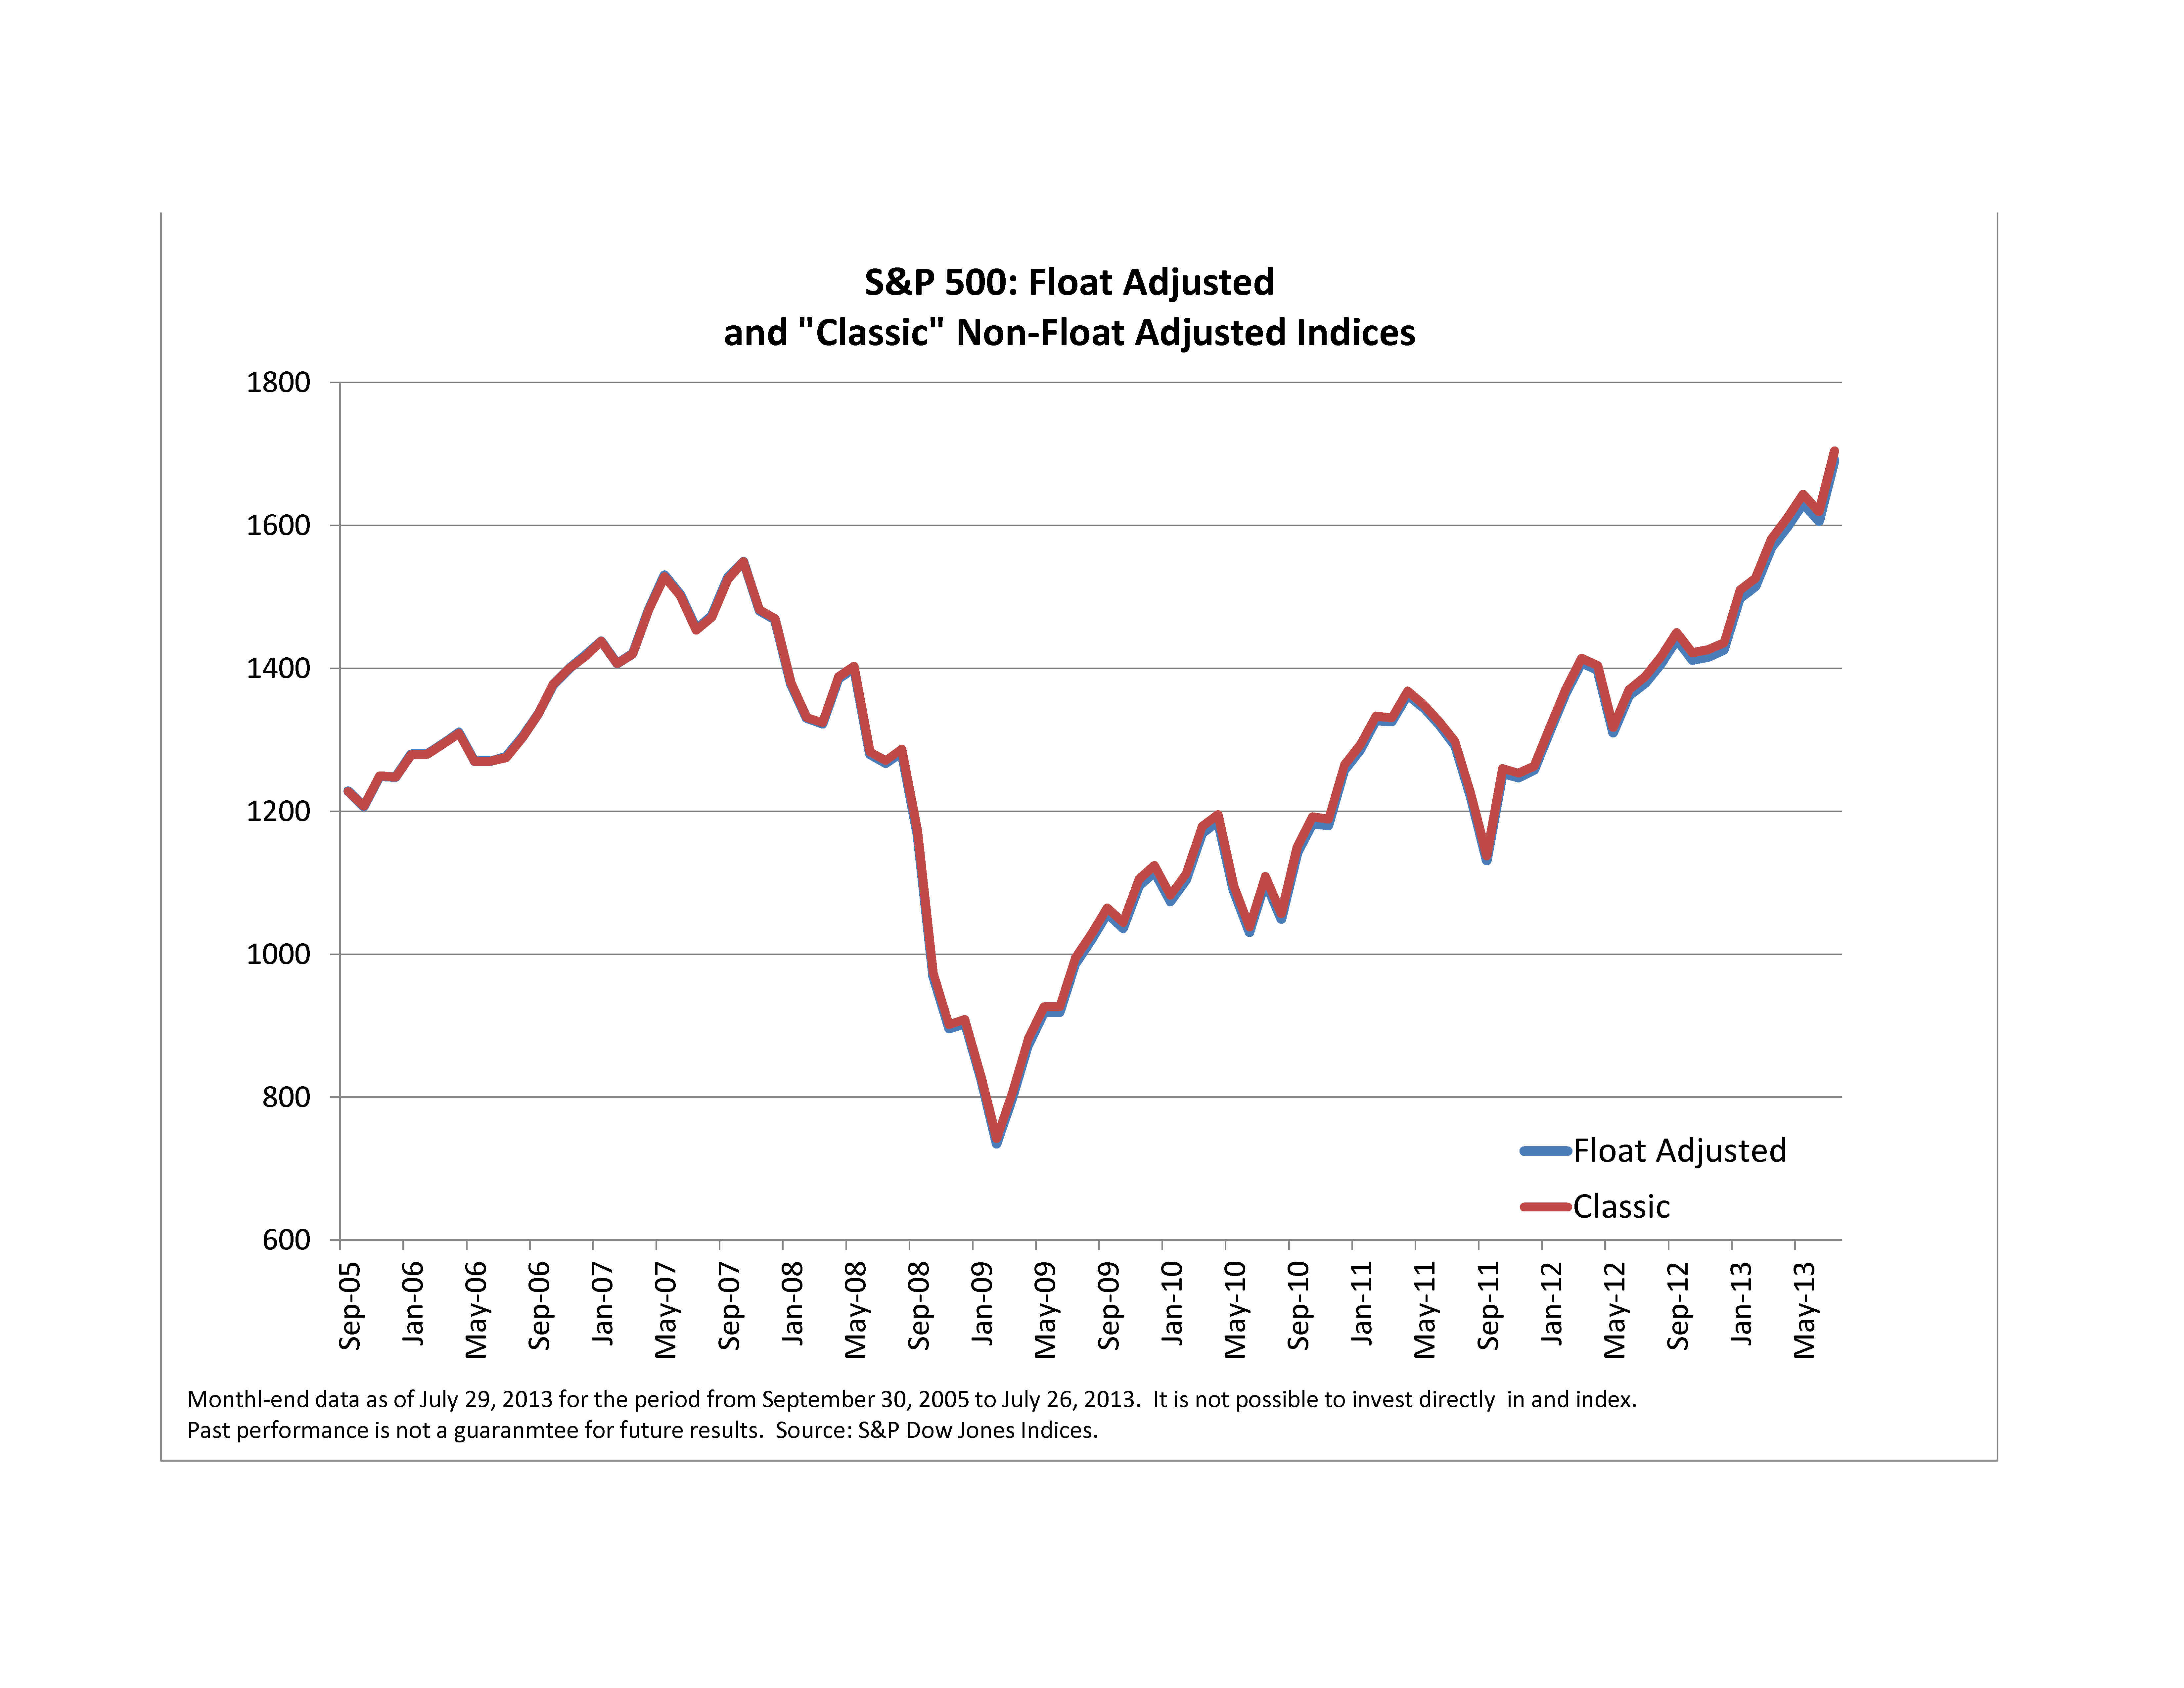
Looking back to September 2005, when the index became float adjusted, we can see the results of float adjustment.  The chart shows the official or float adjusted S&P 500 and the same index without float adjustment. (S&P Dow Jones Indices calculates both versions.)  In terms of price performance, the difference is very small – barely visible on the chart.  The difference in index levels on July 26, 2013 – almost eight years since the introduction of float adjustment– is 13 index points or 77 basis points.  The weight of the ten largest stocks in the float adjusted S&P 500 as of July 26th close is 18.09%, slightly less than the ten largest stocks in the non-adjusted index which were 18.14%.  One of the ten largest stocks in the non float-adjusted index, Wal-Mart, does not make it to the top ten in the float adjusted index because closely held shares are excluded.

Does all this mean that float adjustment was unnecessary? No. Rather the average float factor – the percentage of shares in public float – across all 500 stocks in the index today is over 97%. In the U.S. large cap market segment that the S&P 500 tracks, the vast majority of stock is not closely held.  Compare the 97% to the same statistic for the S&P Small Cap 600, 91% or the S&P Europe 350 at 82%.

Float Chart

Details on float adjustment are available on the S&P Dow Jones Indices web site,

The posts on this blog are opinions, not advice. Please read our Disclaimers.

What Municipalities are Higher Risk?

Contributor Image
J.R. Rieger

Former Head of Fixed Income Indices

S&P Dow Jones Indices

Data as of July 25, 2013

What Municipalities are Higher Risk?

The bankruptcy of the City of Detroit has raised questions about what other municipalities might be the next to focus on.  In general, bonds with higher yields are riskier than bonds with lower yields.  Using bond yields as the sole variable, the following general obligation municipal bond issuers have the highest yielding bond issues* in the S&P Municipal Bond Index:

Maverick County, TX

Scranton, PA

Central Falls, RI

Northern Mariana Islands

Woonsocket, RI

Bellwood, IL

Riverdale, IL

Harvey, IL

*Review focused on bonds issued by and are the general obligation of counties and cities. No district, special tax or land backed bonds were reviewed.  Only bonds that have not previously defaulted on principal and or interest are listed. 

Market Performance:  


The posts on this blog are opinions, not advice. Please read our Disclaimers.

THE Golden Question?

Contributor Image
Jodie Gunzberg

Former Managing Director, Head of U.S. Equities

S&P Dow Jones Indices

What is your long term outlook for gold and where do you see prices moving in the months ahead?

This is one of the questions I was recently asked in a Reuters CCTV2 interview.  While we are not in the business of forecasting, we are in the indexing business where we measure markets – and gold is one of those markets.

Oftentimes the future follows history, so historical index levels are a reasonable place to look in order to get a feel for how prices have behaved in the past.  Please see below for a chart of historical levels of the S&P GSCI Gold.

Source: S&P Dow Jones Indices.  Data from Jan 6, 1978 to July 25, 2013.  Past performance is not an indication of future results.  This chart reflects hypothetical historical performance.  Please see the Performance Disclosure at the end of this document for more information regarding the inherent limitations associated with backtested performance.
Source: S&P Dow Jones Indices. Data from Jan 6, 1978 to July 25, 2013. Past performance is not an indication of future results. This chart reflects hypothetical historical performance. Please see the Performance Disclosure at the end of this document for more information regarding the inherent limitations associated with backtested performance.

As I pointed out in a previous post, gold is having its worst year since 1980.  From Jan 1980 until June 1982 gold in the index lost 65%, then rebounded 69% by Jan 1983.  This time gold’s bottom – so far – was on June 27, down 37% from its peak in Aug 2011. This month it is up 8.5% so if the rally looks like last time, there may be about 30% left, but that is only if the rally this time follows the symmetry of history. Another possibility is that gold could fall another 30% and have a loss like in the 1980-82 period.

What prompted the interview on July 22 was the biggest one day move of gold since June 29, 2012. See the Q&A below for the OTHER GOLDEN QUESTIONS:

1. Gold reached a one month high earlier today – it was the biggest 1-day rally in over a year. What triggered today’s rally?  Gold gained 3.6% in the S&P GSCI and DJUBS mainly on some weaker than expected data from the Fed that drove the price higher than 1300, an important point for technical traders. It went further and  broke 1307, then 1315.

2. Why has gold dropped precipitously this year? Gold had it worst two days since 1980 mainly since the US Fed announced in June it would slow its quantitative easing. The demand for gold as a safe haven may have disappeared after that announcement.

3. And – what’s behind the 10% rebound this month? The rebound is on the fundamental story of expanding reserves from the banks, whether it’s the Fed, ECB or Bank of Japan, the demand is picking up while the ETF selloff seems to have eased.

Source: Blackrock. ETP Landscape, Industry Highlights, June 30, 2013.

4. Why have commodities become more sensitive to supply shocks? And what does this mean for an investor’s strategy? The world’s economy may be shifting from one driven by expansion of supply to one driven by demand. In that case, inventories may be lower so commodities will be more sensitive to supply shocks. For investors, it means they may benefit from strategies that are more flexible to change weights or contracts based on the fluctuations of inventory and price.

5. Why are we seeing an unprecedented summer surge in exports of gasoline, diesel and other fuels?  There is an oversupply from a demand decline from Asia’s slowdown. Gasoline exports may slow as refiners hit their sales quotas before the government decides whether to increase allocations. Read more from this Bloomberg article.

6. Who is benefiting from this surge?  International consumers benefit from the supply spillover into their respective regions. Generally, the higher the inventory, the lower the prices.

7. And how is this export boom affecting pricing in the oil market? The refiners are the consumers of oil to make the gasoline so if demand slows the impact on oil is negative. However, it varies by regional fundamentals as evidenced by the 14.3% gain in the S&P GSCI (WTI) Crude Oil versus only 80 basis points in more international S&P GSCI Brent Crude. Read more from this Reuters article.

The posts on this blog are opinions, not advice. Please read our Disclaimers.

Does Past Performance Matter?

Contributor Image
Aye Soe

Former Managing Director, Global Head of Core and Multi-Asset Product Management

S&P Dow Jones Indices

The phrase “past performance is not a guarantee of future results” has never rung more true for active mutual funds.  Our semi-annual publication, the Persistence Scorecard, takes a look at the performance of top quartile active funds over three- and five-year consecutive 12-month periods.  Based on the most recently released report, out of 269 large cap funds that were in the top quartile as of March 31 2011, only 3.35% (amounting to only 9 funds) remain in the top quartile at the end of March 2013.  It is worth noting that of the 102 mid cap funds that were in the top quartile, there was none left at the end of March 2013.

In short, the report is a sobering reminder that we cannot use the past performance figures as the sole or the most important criteria in fund selection.  In addition, the transition matrices in Report 4 and 5 suggest that a healthy percentage of top quartile funds in the subsequent period come from prior period second or third quartiles.


The posts on this blog are opinions, not advice. Please read our Disclaimers.

When Diversification Fails

Contributor Image
Craig Lazzara

Former Managing Director, Index Investment Strategy

S&P Dow Jones Indices

Diversification means different things in different contexts.  We can speak, for example, of diversification within an equity portfolio — i.e., of holding a number of stocks with potentially-offsetting risks, as opposed to concentrating on only one issue or on a handful of similar stocks.  Or we can think of diversification across asset classes — e.g., by adding bonds, or international stocks, or commodities to a (diversified) U.S. equity portfolio.  Conventional wisdom smiles on these two forms of diversification, and rightly so, since the final diversified portfolio typically has a higher expected return, or lower expected risk, than the starting portfolio.

But diversification might not always be a good idea.  Suppose I go a casino, find the roulette wheel, and bet on a number at random.  I’m likely to lose my money.  If I do the same thing a second time, and a third, the result is likely to be the same.  I haven’t created a diversified portfolio of bets — I’ve merely repeated the same mistake several times over.

A recent white paper asks whether the selection of active investment managers is a useful or fruitless form of diversification.  (Spoiler alert: fruitless.)  Why?  Active managers, more often than not, underperform the indices against which they’re benchmarked.  An investor who chooses an actively-managed fund over an index fund is therefore more likely than not to underperform.  Adding a second and third actively-managed fund is likely to leave the investor worse off than he was with only one (just as multiple turns at the roulette wheel are likely to leave a gambler poorer than he was after his first bet).

If it were easy to find outperforming active funds, diversifying active management might be beneficial.  But it’s not easy — and that implies, as discussed here, that picking active managers is one of those areas where diversification fails.

The posts on this blog are opinions, not advice. Please read our Disclaimers.