Get Indexology® Blog updates via email.

In This List

History, Real and Simulated

Video: The Main Themes Driving Commodity Performance in 2013

Volatility skips over the municipal bond market

Secured, Or Unsecured, That Is The Question

Tennis Without a Net

History, Real and Simulated

Contributor Image
Craig Lazzara

Former Managing Director, Index Investment Strategy

S&P Dow Jones Indices

Show me a man who’s never been burned by relying on a backtest and I’ll show you a man who’s never relied on a backtest at all  (either that or a fictional character).  Skepticism toward backtested results is endemic among investment professionals, and rightly so.  And yet… when a new concept comes along, backtested performance may be the only performance available.  Refusing to examine backtested results in that circumstance is tantamount to refusing to consider any new investment idea.

We discuss this problem here: http://us.spindices.com/documents/research/research-the-limits-of-history.pdf, suggesting that skepticism should sometimes extend not only to backtested data, but to live history as well.  Past performance is never a guarantee of future results, but sometimes it’s more useful than other times – whether its source is real or simulated.

The posts on this blog are opinions, not advice. Please read our Disclaimers.

Video: The Main Themes Driving Commodity Performance in 2013

Contributor Image
Jodie Gunzberg

Former Managing Director, Head of U.S. Equities

S&P Dow Jones Indices

A performance review on the two major commodity indices in the market — the S&P GSCI and DJUBSCI. Find out the main themes that has been driving commodity performance since the beginning of 2013.

The posts on this blog are opinions, not advice. Please read our Disclaimers.

Volatility skips over the municipal bond market

Contributor Image
J.R. Rieger

Former Head of Fixed Income Indices

S&P Dow Jones Indices

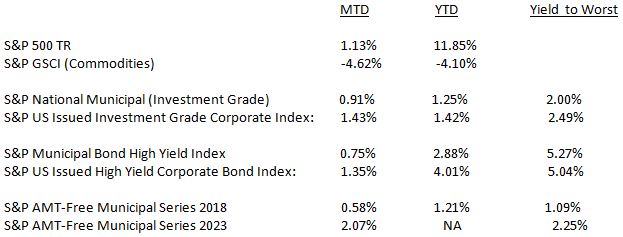
The S&P National AMT-Free Municipal Bond Index is up 1.25% year to date improving by 0.91% so far in April. Exactly where we were at the end of last week.

The ‘belly’ of the curve, or the 5 to 10 year maturity range, is performing as well as longer term bonds as the weighted average yield of bonds in the 5 year S&P AMT-Free Muni Series 2018 Index have come down by 11 bps in April, exactly where we were at the end of last week, to return 1.21% year to date.  Ten year bonds in the 2023 Index have improved by 25bps to end at a weighted average yield of 2.25%.

Even with a slip of 3 bps to the cheaper since month end, the high yield municipal bond market tracked by the S&P Municipal Bond High Yield Index remains on track to making April the 17th consecutive month in a row where it has seen a positive monthly return. Year to date the high yield municipal bond market has returned 2.88% with April contributing 0.75% so far. The yield to worst of these bonds is a 5.27% (tax-free) while investment grade corporate bonds in the S&P U.S. Issued High Yield Corporate Bond Index have a weighted average yield to worst of 5.04% (taxable).

Comparing municipal bonds to other asset classes:


The posts on this blog are opinions, not advice. Please read our Disclaimers.

Secured, Or Unsecured, That Is The Question

Contributor Image
Kevin Horan

Former Director, Fixed Income Indices

S&P Dow Jones Indices

The S&P U.S. Issued High Yield Corporate Bond Index is returning 4.01% year-to-date with a weighted average yield of 5.78%.  Similar to high yield bonds—whose credit ratings are below the investment grade cutoff of ‘BBB’ assigned by the rating agencies—are senior loans. William Shakespeare’s famous quote from Hamlet, “To be, or not to be, that is the question” can be rephrased by investors comparing high yield to senior loans as “secured, or unsecured, that is the question,” when pondering the risks of each product. Senior loans rank higher in the capital structure and are secured to the assets of the business, unlike the unsecured nature of high yield bonds. The loan’s coupon is typically the higher of a floor rate or a certain spread over three-month LIBOR. Because their coupons are tied to a short-term rate, senior loans have less interest rate risk and are considered a floating rate instrument. In a rising rate environment, senior loans are at an advantage to high yield whose bullet structure and fixed coupon would be negatively affected. Not surprisingly, senior loans tend to have slightly smaller, but less volatile returns than high yield bonds (See Total Returns table).

When investing in lower rated credit instruments, the risk of default should always be a concern. Though now, after the 2008 financial crisis, the majority of companies have put their balance sheets back in relatively good financial shape. Presently, default rates are near historical lows, with senior loan defaults at 1.4% and high yield defaults at 2.3%.

Weighing the risks, both senior loans and high yield bonds are attractive investments. Not only because of their higher yields, but also because they are relatively short investments which, when compared to other long term investments, won’t be as affected by changes in long term rates. The duration of the S&P U.S. Issued High Yield Corporate Bond Index is 5 years, while the average life of senior loan is 4.48 years as measured by the S&P/LSTA U.S. Leveraged Loan 100 Index.

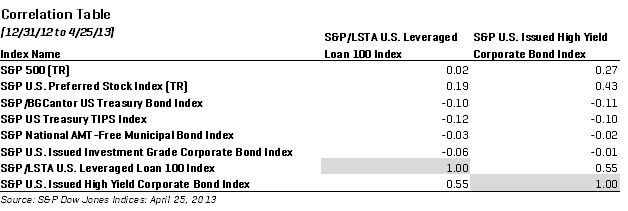
An additional benefit of these two investment choices is that their returns are negatively correlated to other markets, so as one product is underperforming the other is providing return (See Correlation Table).


Capture2

The posts on this blog are opinions, not advice. Please read our Disclaimers.

Tennis Without a Net

Contributor Image
Craig Lazzara

Former Managing Director, Index Investment Strategy

S&P Dow Jones Indices

Indices existed well before the launch of indexed financial products. The Dow Jones Industrial Average, e.g., goes back to 1896; the first indexed institutional portfolios appeared in the 1970s, the first index mutual fund in 1976, and the first index-tracking exchange traded funds in the 1990s. In all these cases, the index provider was independent of the provider of the index-linked financial product.

We think that this independence is an under-appreciated aspect of the success and growth of indexed assets. There are three distinct steps that separate the investor from the product:

  • Data — price and volume data must first be created (on a securities exchange or otherwise) and aggregated
  • Index — using price data and other inputs, an index is created
  • Product — an investment product is created by linking to an index

Independent index providers (ourselves prominent among them) occupy only the middle stage of this process.

To see why this is important, consider what happens when the second step is combined with either the first or the third. For an example of why combining the first two steps (data generation and index creation) is undesirable, think of the word “LIBOR.” The LIBOR scandals of the last year were only possible because the same entities controlled both the data and the index. An independent provider would have had the ability to audit and challenge the raw inputs, helping to insure the integrity if the index creation process.

Combining steps two and three can be equally problematic, if less obviously so. When the same entity provides both index and product, how can the end user assess the performance of the index portfolio manager? And how can he know whether index construction decisions are being driven by the best interests of the client or by the commercial interests of the product provider?

Investing in an indexed product without an independent index provider is like playing tennis without a net. It may be good exercise, but it’s not the same game.

The posts on this blog are opinions, not advice. Please read our Disclaimers.