Get Indexology® Blog updates via email.

In This List

Follow the Small Green Footprints (of Natural Gas) to Find the Fortune Year-to-Date DJ-UBS CI is off 0.58%

A Pot of Cotton at the End of the Rainbow Year-to-Date S&P GSCI is off 0.19%

US Municipal Bond Market Data - March 14, 2013

Low Volatility: Active or Passive?

Follow the Small Green Footprints (of Natural Gas) to Find the Fortune Year-to-Date DJ-UBS CI is off 0.58%

Contributor Image
Jodie Gunzberg

Former Managing Director, Head of U.S. Equities

S&P Dow Jones Indices

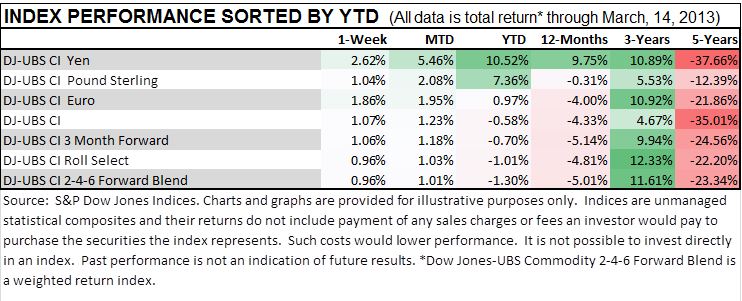
The DJ-UBS CI Energy Subindex is the best performing sector in the index, up 2.2% this week contributing to a 3.2% MTD return and 4.0% YTD return.  Although the International Energy Agency’s (IEA) projection of 820 kb/d annual growth in global oil demand for 2013 is less than the 1.4 mb/d growth average for non-recessionary years from sluggish economic signals, the DJ-UBS CI Natural Gas, gained 6.1% this week, bringing the month’s return to 9.0% and YTD to 9.9%. The Energy Information Administration (IEA) reported a drop in U.S. inventories that was bigger than expected based on cold weather and above-average nuclear power plant outages, which kept the momentum to the upside.

Driven by solid mill buying and U.S. exports, the DJ-UBS CI Cotton gained 5.0% this week, bringing its YTD return up to 19.5%. It is the best performing commodity in the index this year. The U.S. Department of Agriculture (USDA) has forecast a record global surplus, but most of those reserves are expected to be within China’s stockpiles and unavailable to the global marketplace. The International Cotton Advisory Committee (ICAC) stated China’s cotton reserve has continued to expand at “a ferocious rate” and is projected to reach 8 million metric tons (36.74 million bales) by the end of the 2012-13 marketing year.

The DJ-UBS CI Corn and DJ-UBS CI Wheat have also been strong performers recently.  A weaker U.S. dollar supported both of these grains but the DJ-UBS CI Corn, up 3.7% for the week and 1.9% MTD, was driven by tight old-crop supplies, while the DJ-UBS CI Wheat rose 4.2% this week and 1.4% MTD, driven by high demand from livestock feeders.

DJ_UBS_Performance

The posts on this blog are opinions, not advice. Please read our Disclaimers.

A Pot of Cotton at the End of the Rainbow Year-to-Date S&P GSCI is off 0.19%

Contributor Image
Jodie Gunzberg

Former Managing Director, Head of U.S. Equities

S&P Dow Jones Indices

The S&P GSCI Agriculture is the best performing sector MTD, up 1.3%.  This is mainly due to the S&P GSCI Cotton, which gained 5.0% this week, bringing its YTD return up to 19.5%. It is the best performing commodity in the index this year, mainly driven by solid mill buying and U.S. exports. The U.S. Department of Agriculture (USDA) has forecast a record global surplus, but most of those reserves are expected to be within China’s stockpiles and unavailable to the global marketplace. The International Cotton Advisory Committee (ICAC) stated China’s cotton reserve has continued to expand at “a ferocious rate” and is projected to reach 8 million metric tons (36.74 million bales) by the end of the 2012-13 marketing year.

The S&P GSCI Corn and S&P GSCI Wheat have also been strong performers recently.  A weaker U.S. dollar supported both of these grains but the S&P GSCI Corn, up 3.7% for the week and 1.9% MTD, was driven by tight old-crop supplies, while the S&P GSCI Wheat rose 4.2% this week and 1.4% MTD, driven by high demand from livestock feeders.

Reported sluggish economic signals underpinning the International Energy Agency’s (IEA) projection of 820 kb/d annual growth in global oil demand for 2013 is less than the 1.4 mb/d growth average for non-recessionary years.  This drove the S&P GSCI Brent Oil down 1.2% this week, contributing to the S&P GSCI Energy sector loss of 12 basis points this month.  However, the sector is still positive 1.0% YTD and is the only one up in the index for the year. Supporting the S&P GSCI Energy is the S&P GSCI Natural Gas, which is up 6.2% this week, bringing the month’s return to 9.2% and YTD to 10.9%. Continued  larger-than-expected inventory drawdowns on cold weather and above-average nuclear power plant outages kept the momentum to the upside.

GSCI_Performance

The posts on this blog are opinions, not advice. Please read our Disclaimers.

US Municipal Bond Market Data - March 14, 2013

Contributor Image
J.R. Rieger

Former Head of Fixed Income Indices

S&P Dow Jones Indices

High yield municipal bond yields and relative spreads to investment grade munis have moved to lows not seen since 2008.  The S&P Municipal Bond High Yield Index has shown a positive total return of over 1.68% year to date and over 14% since this time last year.  The yield spread between high yield and investment grade municipal bonds is now at 265bps or 2.65% (on March 15, 2012 the spread was 351bps).

Bp_Spread_Rieger

Investment grade municipal bond yields have moved up and prices down two weeks in a row.  These have not been big moves but moves to downside in any event.  Barely in positive territory, investment grade tax-exempt bonds tracked in the S&P National AMT-Free Municipal Bond Index have returned a positive 0.11% ytd.  The weighted average yield to worst for bonds in this index is a 2.14% or about 9 basis points cheaper than the end of the previous week.  The yield to worst results in a Taxable Equivalent Yield of 3.29%.  The Dow Jones Corporate Bond Index is yielding 2.62% to worst, so municipal bonds are remaining incrementally higher yield than their counterparts in the corporate bond market.

Muni_Bond_Performance_Rieger


Comparing returns of municipal bonds to other asset classes:

Index:                                                                   YTD Returns:

S&P 500 (TR)                                                          10.14%

S&P GSCI (TR)                                                         -0.19%

S&P National Municipal                                              0.11%

S&P Municipal High Yield                                           1.68%

S&P/BGCantor US Treasury 7 – 10 Yr                     -1.33%

Taxable Equivalent Yield based on a 35% marginal tax rate

The posts on this blog are opinions, not advice. Please read our Disclaimers.

Low Volatility: Active or Passive?

Contributor Image
Craig Lazzara

Former Managing Director, Index Investment Strategy

S&P Dow Jones Indices

A recent posting suggested that institutional investors interested in exploiting the low volatility anomaly should do so by using active managers rather than one of the several passive vehicles available.  Far be it from me to criticize anyone for talking his own book, since I’m about to do it – but this is reminiscent of the debate that active and passive managers have been having for at least the last 30 years.  Despite the assertions in the article, there’s abundant evidence that passive indices can deliver access to the low volatility effect quite efficiently.

I suspect that both active and passive managers of low volatility strategies could agree on two propositions:

  • Active low vol or minimum variance strategies should be compared to low volatility indices, not to broad benchmarks like the S&P 500 or Russell 1000.  Doing so systematically is the only way to evaluate the author’s claim that active implementation beats passive in this space.
  • Regardless of implementation method, the low volatility anomaly is worth a very serious look for any alpha-seeking institution or individual.

The posts on this blog are opinions, not advice. Please read our Disclaimers.