Get Indexology® Blog updates via email.

In This List

US Municipal Bond Market Data - March 14, 2013

Low Volatility: Active or Passive?

US Municipal Bond Market Data - March 14, 2013

Contributor Image
J.R. Rieger

Former Head of Fixed Income Indices

S&P Dow Jones Indices

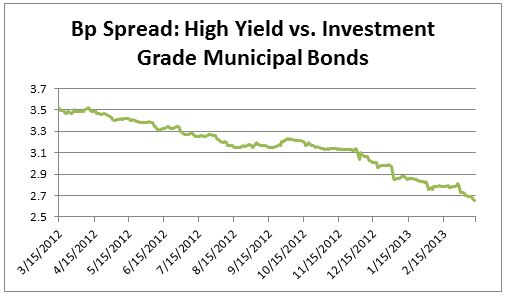
High yield municipal bond yields and relative spreads to investment grade munis have moved to lows not seen since 2008.  The S&P Municipal Bond High Yield Index has shown a positive total return of over 1.68% year to date and over 14% since this time last year.  The yield spread between high yield and investment grade municipal bonds is now at 265bps or 2.65% (on March 15, 2012 the spread was 351bps).

Bp_Spread_Rieger

Investment grade municipal bond yields have moved up and prices down two weeks in a row.  These have not been big moves but moves to downside in any event.  Barely in positive territory, investment grade tax-exempt bonds tracked in the S&P National AMT-Free Municipal Bond Index have returned a positive 0.11% ytd.  The weighted average yield to worst for bonds in this index is a 2.14% or about 9 basis points cheaper than the end of the previous week.  The yield to worst results in a Taxable Equivalent Yield of 3.29%.  The Dow Jones Corporate Bond Index is yielding 2.62% to worst, so municipal bonds are remaining incrementally higher yield than their counterparts in the corporate bond market.

Muni_Bond_Performance_Rieger


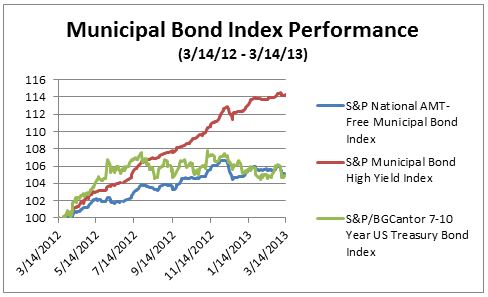
Comparing returns of municipal bonds to other asset classes:

Index:                                                                   YTD Returns:

S&P 500 (TR)                                                          10.14%

S&P GSCI (TR)                                                         -0.19%

S&P National Municipal                                              0.11%

S&P Municipal High Yield                                           1.68%

S&P/BGCantor US Treasury 7 – 10 Yr                     -1.33%

Taxable Equivalent Yield based on a 35% marginal tax rate

The posts on this blog are opinions, not advice. Please read our Disclaimers.

Low Volatility: Active or Passive?

Contributor Image
Craig Lazzara

Former Managing Director, Index Investment Strategy

S&P Dow Jones Indices

A recent posting suggested that institutional investors interested in exploiting the low volatility anomaly should do so by using active managers rather than one of the several passive vehicles available.  Far be it from me to criticize anyone for talking his own book, since I’m about to do it – but this is reminiscent of the debate that active and passive managers have been having for at least the last 30 years.  Despite the assertions in the article, there’s abundant evidence that passive indices can deliver access to the low volatility effect quite efficiently.

I suspect that both active and passive managers of low volatility strategies could agree on two propositions:

  • Active low vol or minimum variance strategies should be compared to low volatility indices, not to broad benchmarks like the S&P 500 or Russell 1000.  Doing so systematically is the only way to evaluate the author’s claim that active implementation beats passive in this space.
  • Regardless of implementation method, the low volatility anomaly is worth a very serious look for any alpha-seeking institution or individual.

The posts on this blog are opinions, not advice. Please read our Disclaimers.