Since the beginning of 2019, the Brazilian stock market has been in bullish territory, generating double-digit gains in January alone (10.59% in local currency and 17.71% in U.S. dollars).[1] Market participants are calling for a strategy to help them take advantage of the current favorable view on Brazilian equities. The S&P/B3 High Beta Index may offer a solution.
Beta is a measure of the risk of a security with respect to the entire market (as defined in the Capital Asset Pricing Model). In other words, it gives an expectation of how a security return will respond to general market movements.
In a rising market, leveraged strategies are frequently used to gain a multiple of the daily return of a benchmark. Leverage is obtained traditionally via derivatives with their respective expenses, fees, gains, and losses. When compounding daily returns, the result may deviate from the original strategy. Moreover, there are market participants with leverage constraints.
The S&P High Beta Indices are designed to serve as a benchmark for equity strategies that aim to achieve a multiple of index returns without leverage. The indices usually select the securities that exhibit the highest sensitivity to the underlying broad-based benchmark, as measured by beta. Securities are weighted by their betas, with the most sensitive stocks receiving the highest weights in the index.
Therefore, the S&P High Beta Indices allow market participants to initiate a bullish strategy in the short term.
The S&P/B3 High Beta Index is designed to measure the performance of the 25% of Brazilian stocks that are most sensitive to changes in broad market returns as represented by the S&P Brazil BMI. Sensitivity to market movements is the beta of each individual stock over the past 12 months in Brazilian reals.
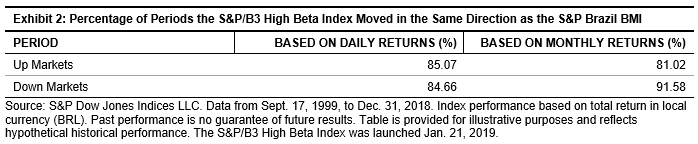
To review how often the strategy follows the direction of the benchmark, we observed the behavior of the S&P/B3 High Beta Index when the S&P Brazil BMI had positive returns (an up market) and when the S&P Brazil BMI had negative returns (a down market). Results varied when using daily returns or monthly returns. In daily returns, we can see that the S&P/B3 High Beta Index moved in the same direction as the S&P Brazil BMI 85.07% of the time in up markets and 84.66% of the time in down markets. On a monthly basis, the results were different, with the index moving the same direction as the market 81.02% of the time during positive months and 91.58% of the time in down months (see Exhibit 2).
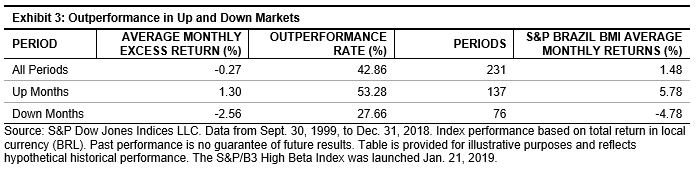
The outperformance rate during the up periods was 53.28%, generating roughly a 1.3% average monthly excess return, while the negative excess return during down periods was -2.56%, outperforming the market just 27% of the time (see Exhibit 3).
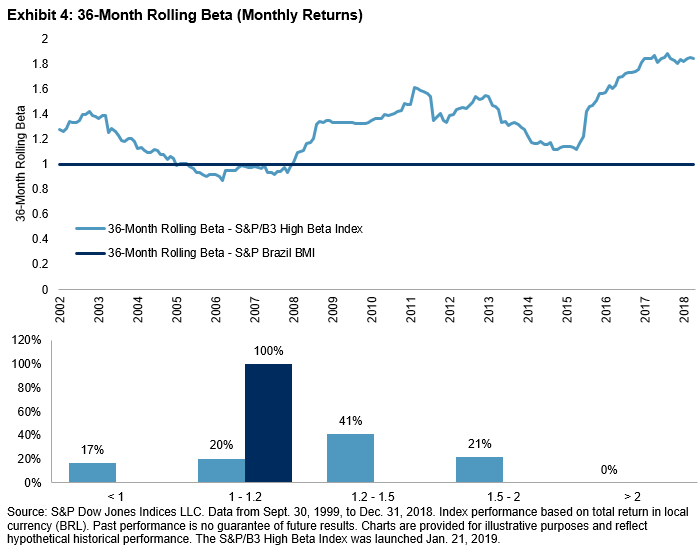
The resulting beta of the S&P/B3 High Beta Index versus its benchmark is also aligned with the strategy. Exhibit 4 shows the 36-month rolling beta from Aug. 31, 2002, to Dec. 31, 2018. In 63% of the months, the rolling beta was greater than 1.2.
The results show that the S&P/B3 High Beta Index has provided a multiple of the S&P Brazil BMI return in up and down markets. Because of that, the index may serve as a solution for participants with leverage constraints.
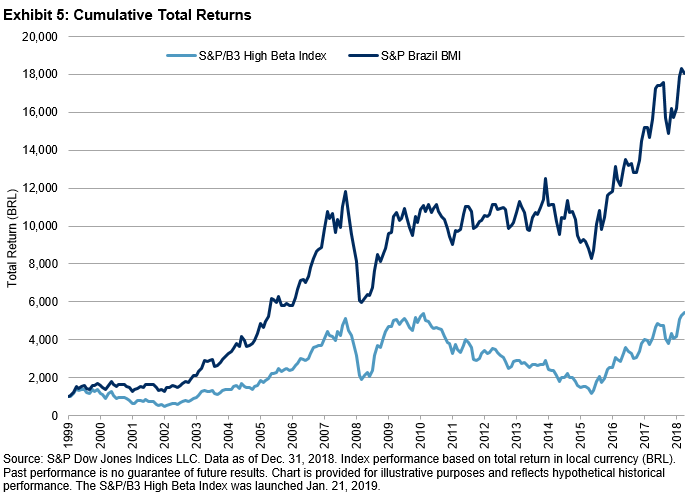
The results also indicate that the use of this strategy is highly tactical. Exhibit 4 demonstrates that the index is not a basis for a buy-and-hold strategy. As geometric compounding kicks in, over a long-term investment horizon, the index underperformed the broad market over the period studied (see Exhibit 5).
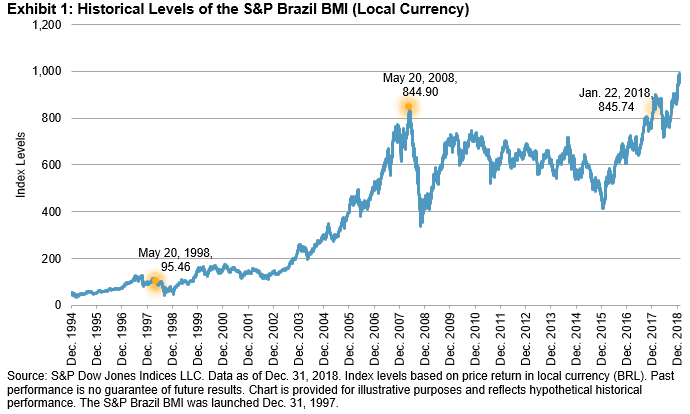
[1] Source: S&P Dow Jones Indices LLC. Data based on the S&P Brazil BMI (Local Currency) (PR). The Brazilian stock market started to show an upward trend in the 1990s until it peaked in May 2008. The S&P Brazil BMI increased to 844.90 from 95.46 a decade earlier. After this, a period of high volatility lasted almost 10 years. Even though the market reached that peak again on Jan. 22, 2018 (at 845.74), it was viewed with caution, as 2018 was an election year in Brazil.
The posts on this blog are opinions, not advice. Please read our Disclaimers.