The 2017 calendar year noted significant returns after a couple years with nearly flat returns. Continuing with the excitement from 2017, the 2018 calendar year started with exuberance, as the S&P BSE SENSEX reached more frequent lifetime highs through the end of January 2018. However, it failed to sustain these highs, as immediately after the budget was passed, the S&P BSE SENSEX and all other leading indices experienced a sharp fall. As of Dec. 13, 2018, the S&P BSE SENSEX gained approximately 1,872 points YTD, up 6.8% in terms of total returns.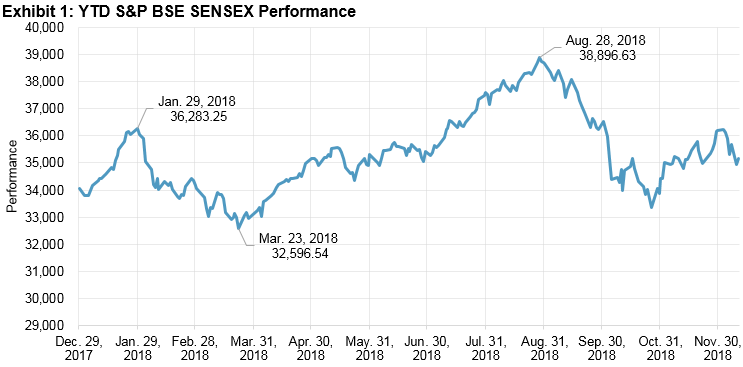
Source: Asia Index Private Limited. Data from Dec. 29, 2017, to Dec. 13, 2018. Index performance based on total return in INR. Past performance is no guarantee of future results. Chart is provided for illustrative purposes.
After witnessing the least volatile year during 2017 (with an annualized volatility of 8.9%), the Indian market has seen an uptick in volatility during 2018, with an annualized volatility of 12.5%. On the global front, higher oil prices, the U.S.-China trade war, and global monetary tightening were the top three drivers of volatility. On the domestic side, factors such as the introduction of the long-term capital gains tax on equity, perceived overall higher valuations of Indian equities, increasing interest rates, concern over falling GDP, and lately, the non-banking financial company (NBFC) liquidity crisis kept the market volatile throughout the year.
The S&P BSE AllCap, which covers more than 95% of India’s listed equity universe in terms of total market capitalization, declined by 4.2%. The declines in the S&P BSE MidCap (-14.1%) and S&P BSE SmallCap (-24.0%), with the simultaneous positive returns for the S&P BSE SENSEX (6.8%) and S&P BSE LargeCap (2.7%), could be attributed to a shift in focus of investors from mid-cap and small-cap stocks to relatively safer bets in large- or mega-cap stocks.
On the sectoral front, the S&P BSE Information Technology and S&P BSE Fast Moving Consumer Goods noted gains of 31.9% and 11.4%, respectively. The revival in demand and sharp depreciation of the Indian rupee helped the Information Technology sector, whereas Fast Moving Consumer Goods stocks noted positive total returns, reflecting India’s consumption story.
Meanwhile, the S&P BSE Finance and S&P BSE Energy ended flat. The S&P BSE Telecom was the worst-performing sector index, with a total return of -41.2%—not surprising, given that most telecommunication services companies tend to be highly leveraged and are facing a potentially intense price war.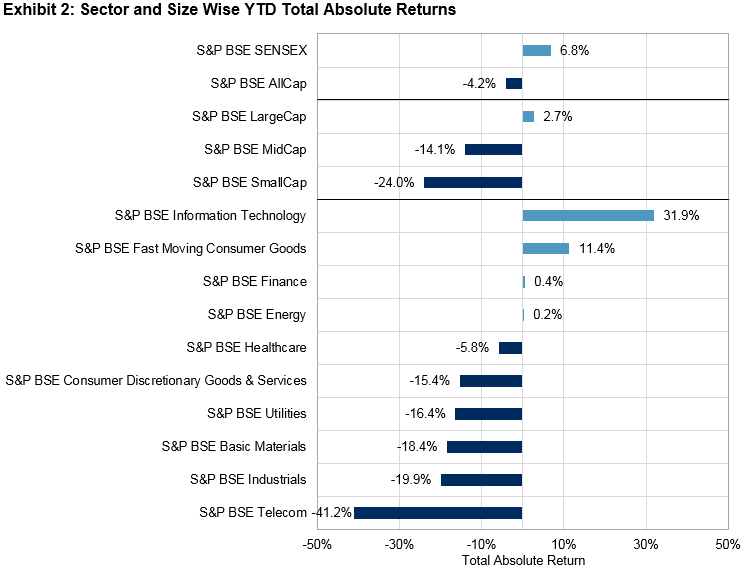
Source: Asia Index Private Limited. Data from Dec. 29, 2017, to Dec. 13, 2018. Index performance based on total return in INR. Past performance is no guarantee of future results. Chart is provided for illustrative purposes.
Outlook: With the U.S.-China trade war not cooling off, the IMF’s recent revision of the global GDP growth estimate to 3.7% in 2018 from 3.9%, and the downward bias in India’s GDP growth, the Indian equity market is expected to remain volatile in the near future. Market participants may also be interested in seeing how the government of India will respond to the recent losses in state elections, and how this may affect voter confidence in the upcoming general elections in 2019.
The posts on this blog are opinions, not advice. Please read our Disclaimers.