Get Indexology® Blog updates via email.

In This List

The World’s Largest Pension Fund Engages in Carbon Disclosure

No New Airport for Mexico Brings Big Hits to Its Markets

The Value of Research: Combining Capacity & Opportunity

Stocks On Pace For The 6th Scariest October Ever

Introducing the S&P BSE Diversified Financials Revenue Growth Index

The World’s Largest Pension Fund Engages in Carbon Disclosure

Contributor Image
Reid Steadman

Former Managing Director, Global Head of ESG & Innovation

S&P Dow Jones Indices

This blog post was co-authored with Dr Richard Mattison, Chief Executive Officer, Trucost, part of S&P Global

On Sept. 25, 2018, Japan’s Government Pension Investment Fund (GPIF)—the world’s largest pension fund—announced its selection of two new low-carbon indices, the S&P/JPX Carbon Efficient Index and the S&P Global Ex-Japan LargeMid Carbon Efficient Index, with an allocation of JPY 1.2 trillion (approximately USD 10.6 billion).[1]

GPIF President Norihiro Takahashi commented, “GPIF hopes that the selected Global Environmental Stock indices will provide an opportunity for companies to work on carbon efficiency and disclosure… Moreover, the indices can include small listed companies that were not covered by other ESG indices, which goes along with GPIF’s idea to improve the sustainability of the overall market… GPIF will continue to actively engage in ESG investment so as to maintain pension reserves for the future generations.”[2]

The broad market approach taken by GPIF presents an interesting case study. The question is, can a traditional passive investment approach help with the transition to a low-carbon economy?

Early indications are positive. Since the launch of these indices, Trucost, part of S&P Global and carbon data provider for the S&P Carbon Efficient Index Series, has seen a 700% uplift in the number of enquiries from companies wanting to understand how their carbon performance is assessed—and how they can improve their performance in the future.

While GPIF’s investment in carbon-efficient indices may be described as passive in style, the team is taking an active approach to market engagement. Just this week, a full capacity audience of 500 companies and investors attended Nikkei’s “Sustainable Development Goals Forum” in Tokyo. GPIF’s president joined the Governor of the Bank of England Mark Carney and Trucost CEO Richard Mattison on stage to outline the importance of the transition to a low-carbon economy. S&P Dow Jones Indices and Trucost highlighted the key components of the S&P Carbon Efficient Index Series.

Governor Carney emphasized the importance of the recommendations from the Taskforce on Climate-related Financial Disclosures (TCFD) and encouraged all companies and investors to assess the resilience of their strategy to different climate transition pathways, using scenario analysis techniques. Many companies at the event described how difficult it was to perform this type of scenario analysis, and Richard Mattison highlighted how new Trucost datasets on carbon price risk will help companies and investors understand how the profitability of their assets will be affected, out to 2030, under a 2 degrees Celsius climate scenario. S&P Dow Jones Indices has also applied this data to create the S&P Carbon Price Risk Adjusted Index Series.

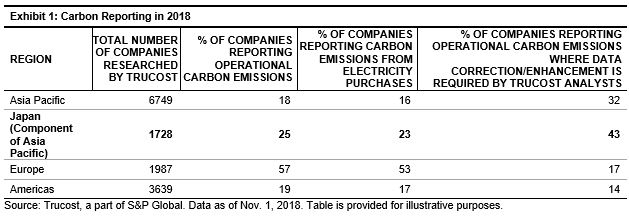
Companies in the Asia Pacific region have traditionally lagged their European and Americas counterparts on carbon reporting, although Japan is already demonstrating significant leadership in the region (Exhibit 1). Of course, in just one month, it is too soon to fully assess the impact of GPIF’s commitment to carbon, but the early signs are promising, and we’ll be paying close attention to the numbers in order to report back on this interesting case study. This engagement with the market by the world’s largest pension fund could lead to significant improvement in disclosure, more efficient markets, and over time, significant carbon emission reductions.

Since the launch of the S&P/JPX Carbon Efficient Index and the S&P Global Ex-Japan LargeMid Carbon Efficient Index, the S&P Global 1200 Carbon Efficient Index, S&P 500® Carbon Efficient Index, and S&P Europe 350 Carbon Efficient Index have been added to the S&P Carbon Efficient Index Series. These indices are now available to all investors.


[1] https://www.gpif.go.jp/en/topics/GPIF%20Selected%20Global%20Environmental%20Stock%20Indices.pdf

[2] https://www.gpif.go.jp/en/topics/GPIF%20Selected%20Global%20Environmental%20Stock%20Indices.pdf

The posts on this blog are opinions, not advice. Please read our Disclaimers.

No New Airport for Mexico Brings Big Hits to Its Markets

Contributor Image
Jaime Merino

Former Director, Asset Owners Channel

S&P Dow Jones Indices

On Monday, Oct. 29, 2018, Andrés Manuel López Obrador, president-elect of Mexico, announced that he would cancel the construction of the new airport in Mexico City, which had reached 30% completion. After a four-day unofficial referendum, in which less than 2% of the voters participated, the upcoming president (who will assume office on Dec. 1, 2018) decided to let people choose the future of the USD 13 billion project that was financed with public bonds. Markets did not respond well and Mexico took a big hit in all aspects: rates, currency, and equities.

In terms of rates, the sovereign bond that matures in December 2024 widened 39 bps on Oct. 29, 2018, the third-largest one-day increase after the U.S. elections in November 2016 (when the bond increased 94 bps in two days), bringing its yield-to-maturity to an all-time high (see Exhibit 1) since November 2008, at 8.76% (as of Oct. 31, 2018). The nominal curve increased 88 bps on average and the real curve increased 58 bps for October, making the sovereign indices fall the most since November 2016 (see Exhibit 2).

As for currency, Oct. 29, 2018, marked the Mexican peso’s sixth-worst day in the past 10 years, with a depreciation of 3.6% against the U.S. dollar. The indices that follow sovereign and corporate bonds issued in U.S. dollars benefited from this depreciation, as shown in Exhibit 2.

The third hit came in equity market, which marked its sixth-worst day as the S&P/BMV IPC—which seeks to measure the performance of the largest and most liquid stocks listed on the Bolsa Mexicana de Valores—fell 4.2%. Exhibit 3 presents the historical performance of the S&P/BMV Mexico Target Risk Index Series—which comprises four multi-asset class indices, each corresponding to a particular risk level intended to represent stock-bond allocations across a risk spectrum from conservative to aggressive—all of which presented their biggest monthly losses since February 2009.

I don’t know what will happen to the new airport, but if I were still to be in the Risk Management Department, I would use this event as a stress test.

The posts on this blog are opinions, not advice. Please read our Disclaimers.

The Value of Research: Combining Capacity & Opportunity

Contributor Image
Hamish Preston

Head of U.S. Equities

S&P Dow Jones Indices

How much should a portfolio manager be willing to pay for research?  This is a question any manager has to answer, but it has recently become more pertinent as newly imposed European rules require the costs of investment research to be unbundled from trading.  Here is a brief overview of a stylized framework for estimating relative research values across markets and constituents.  You can find the full version in our newly-published paper.

If you could subscribe to a series of signals recommending purchase or sale of securities in two different markets, and both sets of signals were equally accurate, which one should you pick?  Since even perfect foresight will provide no value if there is no difference in performance between the relative winners and losers, measuring the dispersion for each market would be a helpful step.  The greater the dispersion, the greater the potential rewards to correctly picking the best-performing constituent(s) in that market.

Exhibit 1 shows that correctly picking the best-performing U.S. small-cap stock would have been better rewarded, on average, than selecting the best performer in the S&P 500; the average monthly dispersion of the former over the last 10 years is far higher than that of the latter.  Does that mean the value of research covering S&P 600 stocks is higher than for S&P 500 members?  Not necessarily – we need to account for capacity.

Exhibit 1: Average Dispersion of Various Markets and Segments

Source: The Value of Research: Skill, Capacity, and Opportunity.  Past performance is no guarantee of future results.  Chart is provided for illustrative purposes.

An investor’s ability to take active positions in each index constituent is related to that constituent’s market capitalization; there is more capacity to maintain an active position in Apple, with its $1 trillion market capitalization, compared to a smaller company.   Exhibit 2 shows that there has typically been a trade-off between dispersion and the size of constituents in various markets.  While the expected percentage reward from successful active bets might be greater among small-cap U.S. stocks, the size of an investor’s position might have to be smaller.

Exhibit 2: Higher dispersion has been associated with smaller markets

Source: The Value of Research: Skill, Capacity, and Opportunity.  Past performance is no guarantee of future results.  Chart is provided for illustrative purposes.

We propose capacity-adjusted dispersion as an intuitive measure for estimating relative research values.  It is computed by multiplying each market’s dispersion and average constituent market capitalization and may be understood as the potential scale of the available bets multiplied by the potential magnitude of the returns to successful bets.  While absolute measures are useful, Exhibit 3 displays the ratio between the capacity-adjusted dispersion of various markets and the equivalent measure applied to S&P 500 stocks.

The estimated value of research covering S&P 500 sectors is far larger than research covering S&P 600 stocks; the larger capacity of the sectors outweighs their lower dispersion.  As a result, by combining capacity and dispersion in a single measure, this stylized framework allows us to compare the value of research across different markets.  Our findings suggest that, other things equal, insight into markets with more capacity is especially valuable.  This supports a top-down, rather than stock-centric, approach to asset allocation.

Exhibit 3: Capacity-Adjusted Dispersion in Various MarketsSource: The Value of Research: Skill, Capacity, and Opportunity.  Past performance is no guarantee of future results.  Chart is provided for illustrative purposes.


The posts on this blog are opinions, not advice. Please read our Disclaimers.

Stocks On Pace For The 6th Scariest October Ever

Contributor Image
Jodie Gunzberg

Former Managing Director, Head of U.S. Equities

S&P Dow Jones Indices

The S&P 500 is down 9.4% month-to-date as of the close on Oct. 29, 2018, and is on pace to record its worst Oct. since 2008 and its sixth worst Oct. based on history since 1928.  The other years when the S&P 500 that lost more in Oct. than in Oct. 2018 (so far) happened in 1987, 1929, 2008, 1932, 1937.

Source: S&P Dow Jones Indices.

Also, month-to-date, the S&P 500 is having its 34th worst month on record and its worst month since Feb. 2009, when it lost 11.0%.  The top ten worst months in S&P 500 history in chronological order date back to Nov. 1973, nearly 45 years ago, when the S&P 500 lost 11.4%, the most in 26 years, since Nov. 1948, when it lost 10.8%.

Source: S&P Dow Jones Indices.

Not only is the S&P 500 having a historically bad month but almost all slices of U.S. equities by size, sector and style are losing big too.  Month-to-date, of every style, size and sector, only large cap consumer staples and utilities are positive, up 1.0% and 2.8%, respectively.  Energy was the worst performing sector across the sizes, losing 13.8%, 19.1% and 21.7% in large-, mid-, and small-caps, respectively, as the S&P GSCI (WTI) Crude Oil lost 8.5% month-to-date (through Oct. 29, 2018).

Source: S&P Dow Jones Indices.

The losses are historically big when evaluating the sectors, sizes and styles as well.  This is the 3rd worst month in history for S&P 500 Consumer DiscretionaryS&P 500 EnergyS&P 500 Industrials and S&P 600 Industrials, losing a respective -13.8%, -13.8%, -13.3% and -16.4% (month-to-date through Oct. 29, 2018,) all on pace to post their 2nd worst Oct. in history.  Additionally, there are a total 30 of 42 slices by the composites, sectors, sizes and styles that are on track to post their 2nd worst Oct., and all of them are having one of their top 20 worst months ever – with 13 indices on pace to have their 5th, 4th or 3rd worst ranked months ever.

S&P 500 is from Sep. 1989 and sectors data is from Oct. 1989, except Real Estate is from Nov. 2001, S&P 500 Growth and S&P 500 Value are from Feb. 1994. S&P 400 data is from Jan. 1991 and sectors data is from Jan. 1995, except Real Estate is from Nov. 2001, S&P 400 Growth and S&P 400 Value are from 1998. S&P 600 data is from Jan. 1994 and sectors data is from Jan. 1995, except Real Estate is from Nov. 2001, S&P 600 Growth and S&P 600 Value are from Apr. 1997. All Data ending Oct. 29, 2018. Index data is Price Return.

In the past, the S&P 500 lost in all the Nov. months following the most losing Oct.’s.  The Nov. returns of the S&P 500 in 1987, 1929, 2008, 1932, 1937 were -8.5%, -13.4%, -7.5%, -5.9% and -10.1%, respectively.  However, in Dec. of each of these years, the S&P 500 was positive except for in 1937 when the index lost an additional 5.0% before bouncing back in Jan. 1938.

There have been some concerns about signs of economic weakness recently including lower than expected inflation, soft housingflat auto sales, plus a slightly decelerating GDP and growing concerns over trade tensions, so analysts may be watching these factors as well as how the Fed raises rates – or not.   Many may be looking for value opportunities as stocks have fallen and value is outperforming growth by the most since Nov. 2016 in large- and mid-caps, and the most since Mar. 2016 in small-caps with respective value premiums of 3.6%, 1.7% and 2.3%.
.


The posts on this blog are opinions, not advice. Please read our Disclaimers.

Introducing the S&P BSE Diversified Financials Revenue Growth Index

Contributor Image
Mahavir Kaswa

Former Associate Director, Product Management

S&P BSE Indices

During the first half of 2018, Asia Index Private Limited launched the S&P BSE Diversified Financials Revenue Growth Index. It is the first index of its kind in India, and it seeks to measure the performance of private (non-state-owned) stocks from the S&P BSE 500 in the finance sector. The index includes the top three quartiles from the eligible universe based on revenue growth criteria as defined in the index methodology.[1] The index is a variable count index; it had 48 constituents as of Sept. 29, 2018. It covers approximately 70% of the S&P BSE Finance in terms of total market capitalization. It is reconstituted semiannually in June and December.

The index offers a diversified exposure to various sub-industries of the BSE Finance sector. As shown in Exhibit 1, the index basket includes 9 banks out of the 38 banks that are part of the S&P BSE Finance. The largest sub-industry in the index is Banks, with a total weight of 30.2% as compared to 63% in the S&P BSE Finance.

As defined in the index methodology, the maximum weight of stocks in the index is capped at 5% with quarterly weight resets. The top 10 stocks in the index account for a total weight of 49.2% as compared to 77.6% in the S&P BSE Finance. As illustrated in Exhibit 2, large cap accounts for a total weight of 61%, whereas the com   bined weight of large and mid caps in the index is 93.5%.

Index Performance and Risk/Return Profile

As shown in Exhibit 3, over the past 10 years, the S&P BSE Diversified Financials Revenue Growth Index outperformed the S&P BSE Finance and the S&P BSE 500 by a considerable margin.

As depicted in Exhibit 4, the S&P BSE Diversified Financials Revenue Growth Index outperformed the S&P BSE Finance and S&P BSE 500 over the 3-, 5-, and 10-year periods studied. Although the index noted higher volatility, the index also noted higher risk-adjusted returns during the same periods.


[1] http://www.asiaindex.co.in/documents/methodology/methodology-sp-bse-allcap.pdf

The posts on this blog are opinions, not advice. Please read our Disclaimers.