Get Indexology® Blog updates via email.

In This List

Surprising but Explainable

Latin America Scorecard: Q3 2018

Adding the “Factor Flavour” to Indexing

Looking Through The Sector Lens

Playing Defense and Offense With Factor Strategies

Surprising but Explainable

Contributor Image
Anu Ganti

U.S. Head of Index Investment Strategy

S&P Dow Jones Indices

Equal-weight indices have a small-cap tilt. Therefore, one might naturally assume that the volatility of equal-weight indices is higher than that of their cap-weighted counterparts. Surprisingly, this is not always the case, and we can understand why using the lens of dispersion and correlation.

Exhibit 1 shows that the volatility of the S&P 500® Equal Weight Index was about 1% less than that of the (cap-weighted) S&P 500, as of the end of Q3 2018. (A key driver of this difference was the Information Technology sector, as the S&P 500 Equal Weight Information Technology Index was 1.6% less volatile than the S&P 500 Information Technology. Readers who are particularly interested in comparing equal-weight and cap-weighted sectors would enjoy perusing our new U.S. Equal Weight Sectors Dashboard.)

Exhibit 2 shows that the dispersion of the S&P 500 Equal Weight Index was consistently higher than that of the S&P 500. This is not a surprising outcome since, as a function of equal weighting, the index has higher weights in smaller, more idiosyncratic stocks.

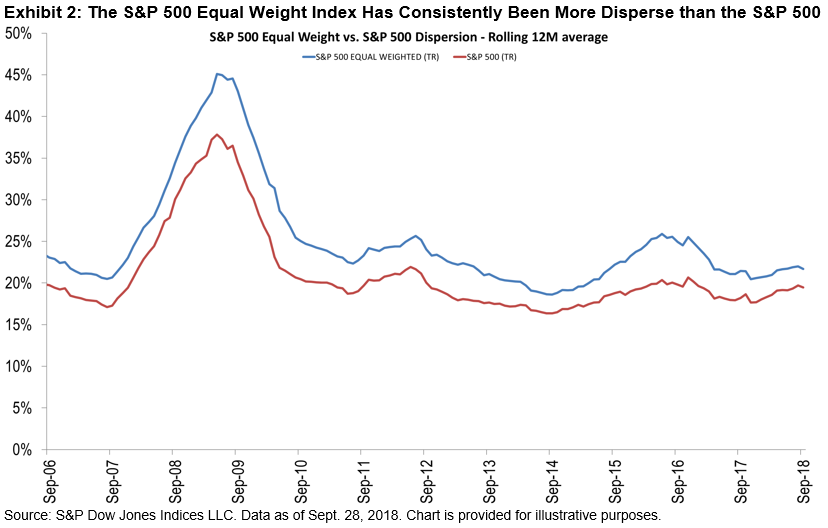
Exhibit 3 provides two important insights about the relative correlation of the S&P 500 Equal Weight Index and its cap-weighted parent:

  • The weighted average correlation of the equal weight index is consistently lower than that of the S&P 500.
  • The spread between the correlation of the two indices has recently widened.

Other things equal, volatility rises as either dispersion or correlation rise. (This interaction helps us, for example, to understand the volatility of the new Communication Services sector.) The equal weight index’s higher dispersion drives volatility higher, but is balanced by its (unusually) lower correlations. This combination caused the S&P 500 Equal Weight Index’s volatility to drop below that of the S&P 500, an unexpected but justifiable outcome.

The posts on this blog are opinions, not advice. Please read our Disclaimers.

Latin America Scorecard: Q3 2018

Contributor Image
Silvia Kitchener

Director, Global Equity Indices, Latin America

S&P Dow Jones Indices

This quarter has brought mixed expectations for the region. The quarter itself resulted in overall positive returns. However, Latin America is still in the red for the year. The S&P Latin America 40, a widely used benchmark for the region, ended the quarter strong with a return of 6.4%. The countries that contributed to this upturn were the two largest markets in the region: Brazil and Mexico. In USD terms, the S&P Brazil BMI returned 5.1%, and in Mexico, the S&P/BMV IPC returned 10.3% for the quarter.

As 2018 enters its last three months of the year, many uncertainties from the earlier months have begun to unfold. Elections in many Latin American countries have concluded, with new leaders in Mexico, Colombia, Chile, Peru, and soon in Brazil. Despite many controversies, the markets have responded positively to their respective elections. In Mexico, NAFTA has been replaced by a similar agreement called the United States-Mexico-Canada Agreement (USMCA). This is good news for Mexico, causing a rally in the country’s equity market at the end of the quarter. Brazil is in the midst of presidential elections, with the first round concluded on Oct. 7, 2018. As predicted, the far-right presidential candidate Jair Bolsonaro won the first of two rounds of elections. In general, his win is seen as more favorable to financial markets compared with the other candidates. This also yielded a rally in the country’s equity market. The other countries did not fare as well when looking at USD returns for the third quarter, with Colombia showing the largest losses, followed by Peru, Chile, and Argentina.

It is interesting to note the important role currencies play in index returns. In the S&P Colombia Select, the S&P/BVL Peru Select, and Chile’s S&P/CLX IPSA, the returns in USD and local currency were not that different. However, in other markets like Brazil or Argentina, currency exchange rates had a greater impact. In Brazil, the local return of the S&P Brazil BMI was almost double compared with the USD return: 9.0% versus 5.1%, respectively. The most dramatic difference was in Argentina, where the USD version of the S&P Argentina BMI was almost flat, at -0.48%, and in ARS, the index soared to 40.7% for the same period. In Mexico, the currency exchange rates had the opposite effect. The S&P/BMV IRT showed better performance in USD than in MXN, with returns of 10.8% and 4.3%, respectively.

Other noteworthy highlights for the quarter saw Energy, Materials, and Financials emerge as the top three sector performers, as measured by the S&P Latin America BMI sector indices. The sectors returned 12.5%, 8.2%, and 6.6%, respectively. Not surprisingly, three of the five best-performing stocks in the S&P Latin America 40 for the quarter were from Energy: Colombia’s Ecopetrol rose 31%, and Brazil’s Petrobras ON and PN shares were up 23% and 18%, respectively.

Besides returns, several indices have shown strong dividend yields for investors seeking income. As expected, indices focusing on dividends and real estate had the highest generating yields. The S&P Dividend Aristocrats® Brasil Index had a yield of 7%. Similarly, in Mexico, the S&P/BMV FIBRAS Index had a yield of nearly 8%. The S&P/BVL Peru Dividend Index had the highest yield of all the indices in this report, with a yield of 8.2%.

So far, this year has been full of ups and downs, and the third quarter brought a bit of hope to investors in the region. There are still three more months to go before the year ends, and as things begin to unfold, it will be interesting to see what is left for Latin America—hopefully one more upswing.

To see more details about performance in Latin America, please see: S&P Latin America Equity Indices Quantitative Analysis Q3 2018.

The posts on this blog are opinions, not advice. Please read our Disclaimers.

Adding the “Factor Flavour” to Indexing

Contributor Image
Koel Ghosh

Former Head of South Asia

S&P Dow Jones Indices

Many people believe that index-based investing and market beta are synonymous. With the growing popularity of index-based investing, exchange-traded funds and index funds based on market benchmarks such as the S&P BSE SENSEX, S&P BSE 100, and S&P BSE 500 are slowly gaining ground. Investors have been familiarizing themselves with market returns linked to these benchmarks that represent the behavior of India’s equity markets. Assets in the passive Indian landscape have witnessed a significant growth with a range of products that have also started expanding to factor-based strategies.

What are these factor indices, and how are they different from standard market benchmarks and sector indices? Let’s look at factor indices using an analogy to tea drinking. While one can have the standard black tea with or without milk, today we are flush with options and different available flavours such as mint, chamomile, lemon, etc. Each of the flavours provides a different experience that differs from the standard.

If we extend this to indices, the S&P BSE SENSEX, S&P BSE SENSEX 50, S&P BSE 100 and similar indices that are market-cap based and showcase the movements of the Indian equity market within the segments they seek to track, be it the top 30 stocks of the market, top 50, or 100. Similarly, other market-cap-based indices such as the S&P BSE LargeCap Index, S&P BSE 150 MidCap Index, and S&P BSE 250 SmallCap Index are designed to represent market segments based on size.

Now if we want to add a new flavour to index design, we could select index constituents based on factors. These factors can be measures of volatility, quality (based on return on equity, accruals ratio, or financial leverage ratio), value (based on book value-to-price, earnings-to- price, or sales-to-price), among others. The resulting index is not market-cap weighted, but rather it is weighted by the specific factor. The behavior of such indices differ from those that are market-cap weighted in that the specific factor plays the primary role in the characteristics of these indices. For example, the S&P BSE Quality Index will have different risk/return characteristics from the S&P BSE SENSEX.

Exhibit 1 demonstrates the behavior of the various S&P BSE factor indices compared with one of India’s market benchmarks, the S&P BSE SENSEX.

The posts on this blog are opinions, not advice. Please read our Disclaimers.

Looking Through The Sector Lens

Contributor Image
Anu Ganti

U.S. Head of Index Investment Strategy

S&P Dow Jones Indices

We’ve recently noted that this month’s market turmoil created a radical reversal of factor returns, poking holes in this year’s momentum bubble.

A similar trend has occurred within sectors.  During the first nine months of 2018, Consumer Discretionary and Info Tech dominated performance, as seen in Exhibit 1.

For the first two weeks of October, however, Exhibit 2 shows that defensive sectors such as Utilities and Consumer Staples outperformed former leaders such as Technology and Consumer Discretionary. The reversal of sectoral fortunes parallels the reversal in factor index performance.

As readers of our U.S. Sector Dashboard will realize, this is not coincidental.  Consumer Discretionary and Info Tech have a strong tilt to Momentum, while Utilities and Consumer Staples are tilted towards defensive factors such as Low Volatility and Value.

Sectors and factors interact in characteristic or typical ways. Investors can look at the world through either lens. Their perception of reality will be improved if they use both.

The posts on this blog are opinions, not advice. Please read our Disclaimers.

Playing Defense and Offense With Factor Strategies

Contributor Image
Aye Soe

Former Managing Director, Global Head of Core and Multi-Asset Product Management

S&P Dow Jones Indices

The domestic equity market, as measured by the S&P Composite 1500®, ended Q3 2018 with a gain of 10.47%. Over the past 10 years, the S&P Composite 1500 had annualized returns of 12.05%, showing an impressive bullish run since the 2008 Global Financial Crisis. Perhaps reflecting the market environment, growth-oriented investment styles, such as momentum and growth, have been the best-performing factors over the past 12 months. For example, the S&P 500® Momentum , S&P 500 Growth , and S&P 500 Pure Growth posted excess returns of 12.46%, 7.3%, and 3.14%, respectively, over the S&P 500 (17.91%).

Empirical evidence shows that factors tend to earn higher risk-adjusted returns than the broad market over a long-term investment horizon; however, their returns can be rather cyclical in near- to mid-term horizons. Much like asset classes, depending on the market environment, some factors outperform and some underperform for extended periods. Using annualized 1-, 3-, 5-, and 10-year returns of various factor strategies, Exhibit 1 highlights the cyclical nature of factor returns.

While factors returns are cyclical, it is still possible to establish a generalized pattern of returns through various market environments. Using the monthly returns from June 30, 1995, through Sept. 30, 2018, we compared large-cap value, quality, momentum, low volatility, and size (represented by the S&P 500 Equal Weight Index) strategies against the S&P 500 (see Exhibit 2). We computed their hit rate (in percentage) in up, down, and all market periods[1]. In addition, we calculated the average monthly excess returns of the factor strategies in those three periods.

We can see that in general, the momentum and quality factors did better than the benchmark in all market periods. In up markets, the quality, momentum, and size factors had above average hit rates (> 50%). In declining markets, factors such as quality and low volatility stand out clearly, with hit rates above 75%. In other words, out of the 280 months that we studied, the S&P 500 had negative returns in 94 months. Of those months, the S&P 500 Low Volatility Index and the S&P 500 Quality Index outperformed over 75% of the time.

In addition, average monthly excess return figures show the magnitude of out- and underperformance by factors in different market environments. In general, during up markets, excess monthly returns of factors such as low volatility, quality, and value tended to be negative. However, a different picture emerged when markets declined, with the low volatility and quality factors posting average monthly excess returns of 2.04% and 0.91%, respectively. Hence, factors such as quality and low volatility generally have defensive properties with asymmetric payoffs, especially for the latter.

Therefore, one can group factors into two camps—return enhancing and risk reducing—with both offering higher risk-adjusted returns than the market over the long run. The momentum factor can potentially offer higher returns than the market in an upward-trending market. Conversely, low volatility and quality offer a higher degree of downside protection while providing limited upside participation.

For more discussion on playing defense and offense with factors, tune into our webinar on Oct. 17, 2018. Please click here to register.

[1]   We define up market as months in which the S&P 500 has positive returns.  Similarly, we define down market as months in which the S&P 500 has negative returns.


The posts on this blog are opinions, not advice. Please read our Disclaimers.