

My earlier blog showed that equal risk allocation is different from equal capital allocation. The S&P Risk Parity Indices had roughly equal risk contribution from all three asset classes, while about 60% of the capital was allocated to fixed income.
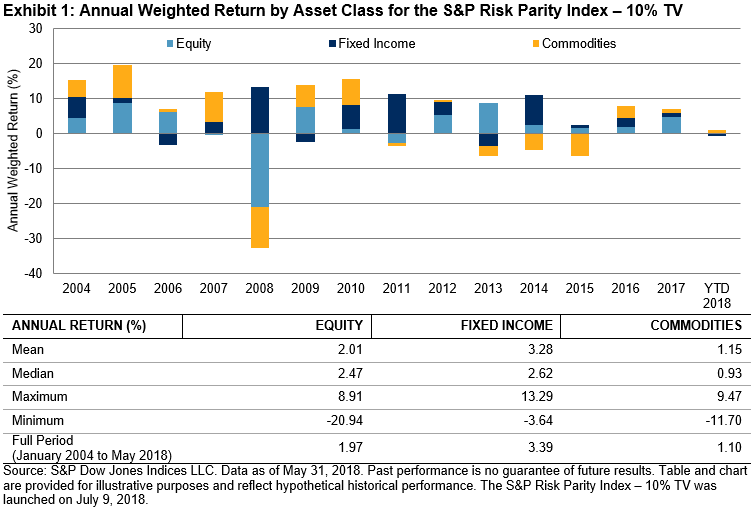
The historical performance of each asset class also showed that equal risk allocation did not lead to equal return contribution (see Exhibit 1). Not surprisingly, fixed income had the highest return to the overall portfolio over the full period studied, as this low risk asset class has significant overweight in risk parity strategies.
The return decomposition of the S&P Risk Parity Index – 10% Target Volatility (TV) showed that the return contribution by asset classes varied significantly from year to year due to changes in the performance of individual asset classes and the correlation among them, affecting the overall portfolio performance. In 2008, equity and commodities experienced market drawdowns, and only the fixed income apportion had a positive return. As a result, the overall portfolio posted a loss.
Another key feature of risk parity strategies is leverage. Risk parity strategies tend to allocate heavily to less volatile asset classes, and managers usually use leverage on low risk asset classes to achieve an overall return that is similar to a market portfolio. The combination of equal risk contribution from multiple asset classes and leverage help a risk parity portfolio to meet the challenges of achieving market returns and reducing the risk of a multi-asset portfolio.
We can see this demonstrated by the S&P Risk Parity Index – 10% TV. For example, its leverage ranged between 1.32 and 2.24 in our back test (see Exhibit 2). Note that leverage is created so that the overall portfolio volatility matches the target volatility each month. As such, leverage rose in low volatility markets and dropped in high volatility markets. On average, the index had a leverage of 168% or 1.68.


