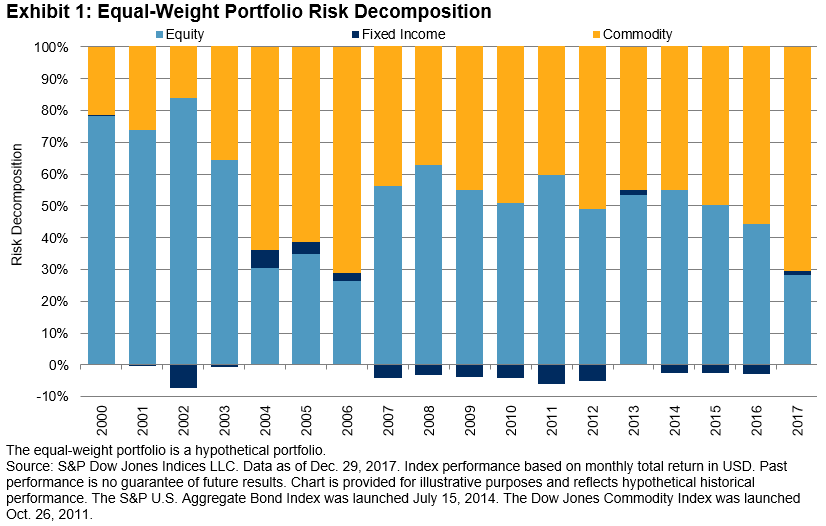
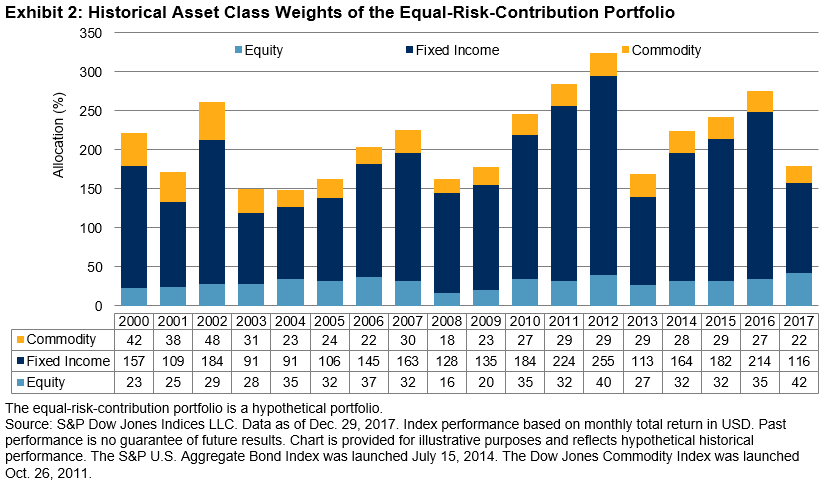
As we highlighted in a prior blog post, the risk decomposition of a multi-asset equal-weight portfolio showed that equities and commodities were the main contributors to total portfolio volatility. We then went on to explore what the weights would have been if we were to form an equal-risk-contribution portfolio consisting of the same assets.
In this post, we review the performance of an equal-weight portfolio against an equal-risk-contribution portfolio, starting in 2000. Exhibit 1 shows historical annualized return and annualized volatility for both portfolios for several lookback time horizons.
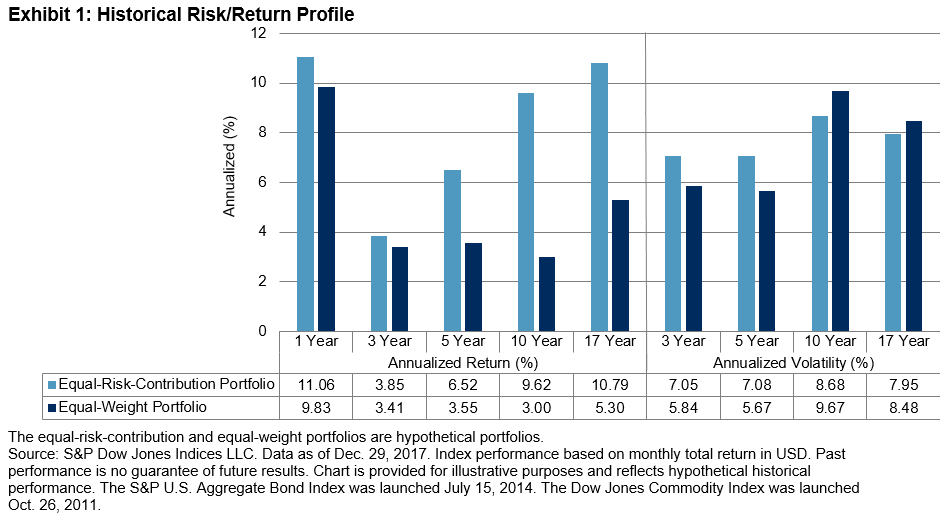
When determining the weights in the equal-risk-contribution portfolio, we set the target portfolio volatility to be equal to the realized portfolio volatility of the equal-weight portfolio from the prior year, subject to a maximum of 10%. Hence, the realized historical volatilities of the two portfolios are similar. This is particularly interesting given the fact that the equal-risk-contribution portfolio’s total nominal weights averaged over 200%.[1]
We can see that the returns for the equal-risk-contribution portfolio were higher than those of its equal-weight counterpart across all measured periods. The long-term horizons (10 years and 17 years), covering periods of bear market(s) in equities and commodities, show relatively high return spreads, which led to substantially higher risk-adjusted returns. We also compute the rolling three-year annualized returns (see Exhibit 2).
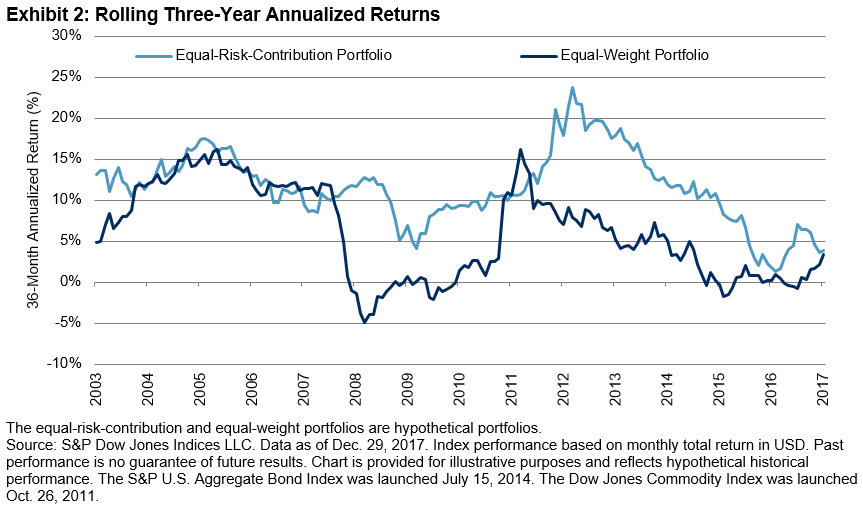
The two portfolios performed similarly in some periods, while in others the equal-risk portfolio noticeably outpaced the equal-weight portfolio. In fact, the equal-risk portfolio outperformed the equal-weight portfolio 84% of the time, by an average of 5.51%.
Over the last several posts, we have demonstrated the merits of constructing multi-asset risk parity portfolios. Compared to an equal-weight multi-asset portfolio, a risk parity portfolio can potentially lead to superior returns on an absolute and risk-adjusted basis. In related future posts, we will take a deeper dive into the S&P Risk Parity Indices.
[1] See Equal-Weighting Versus Equal-Risk-Weighting Strategies
The posts on this blog are opinions, not advice. Please read our Disclaimers.