Get Indexology® Blog updates via email.

In This List

The Importance of Sector Diversification in a Yield-Focused Strategy – Part II

Proactive Fiscal Policy to Be More Proactive: Takeaways From China’s State Council Executive Meeting on July 23, 2018

Why is the GICS Telecommunications Sector Becoming the Communication Services Sector?

Responsible Investor Europe 2018 Conference: What to Watch for in the Remainder of 2018 and 2019

Trading in Facebook Shows Indexing Has Little to Do With Valuation-Based Dislocations

The Importance of Sector Diversification in a Yield-Focused Strategy – Part II

Contributor Image
Qing Li

Director, Global Research & Design

S&P Dow Jones Indices

In our previous blog (The Importance of Sector Diversification in a Yield-Focused Strategy – Part I), we highlighted that sector biases in an unconstrained yield strategy could detract from portfolio returns. In this blog, we will show that addressing the sector concentration issue can improve risk-adjusted returns.

We constructed three sector-diversified portfolios—the dividend yield portfolio, free cash flow yield portfolio, and dividend yield + free cash flow yield portfolio—with each portfolio selecting the top five highest ranking stocks from each sector (see Exhibit 1). Each portfolio was rebalanced on a quarterly basis from December 1990 to December 2017 and weighted equally.

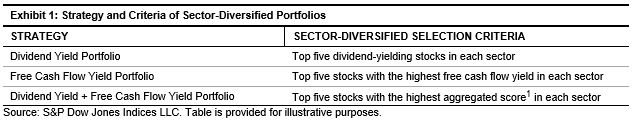
Exhibit 2 shows that, compared with non-sector-diversified portfolios, the sector-diversified portfolios had smaller deviations in active sector weights relative to the underlying broad market. This reduction in sector concentration resulted in higher positive active returns—which is the difference between the total portfolio return and the total benchmark return as measured by the S&P 500® and indicated by total effect. We see the biggest difference in the utilities sector, where the non-diversified portfolios had negative return attributions but the diversified portfolios all displayed positive total effect. In fact, the diversified portfolios showed a positive effect for all sectors in the strategies tested.  

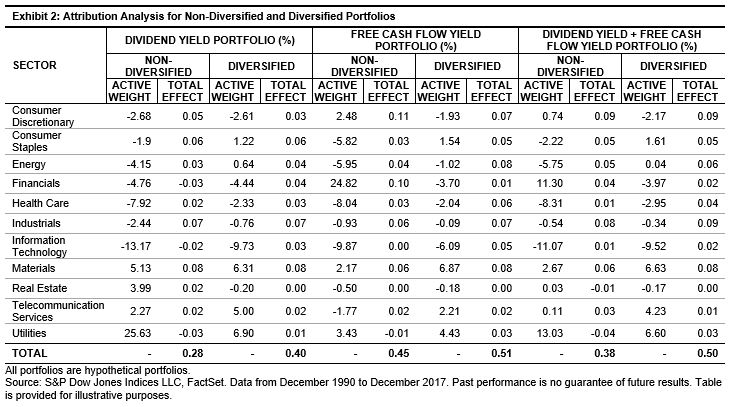
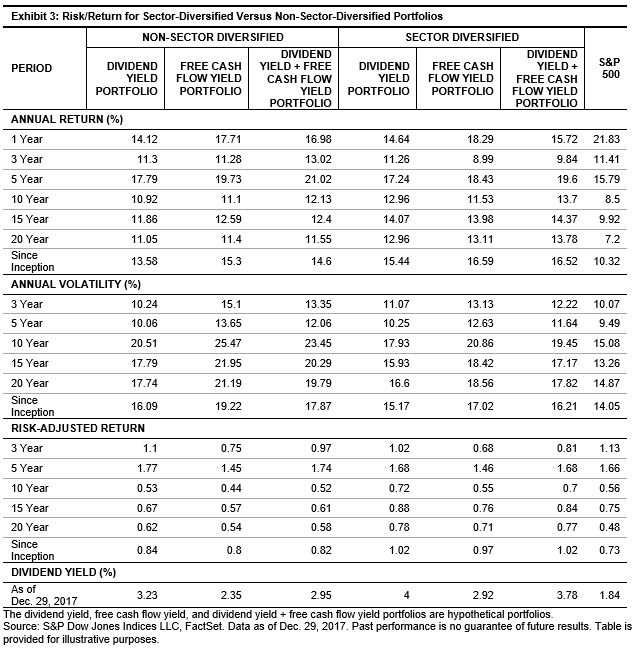
As shown in Exhibit 3, over the long-term investment horizon, the sector-diversified portfolios displayed higher returns and lower volatility than the non-sector-diversified portfolios and the broad market, without sacrificing yield.

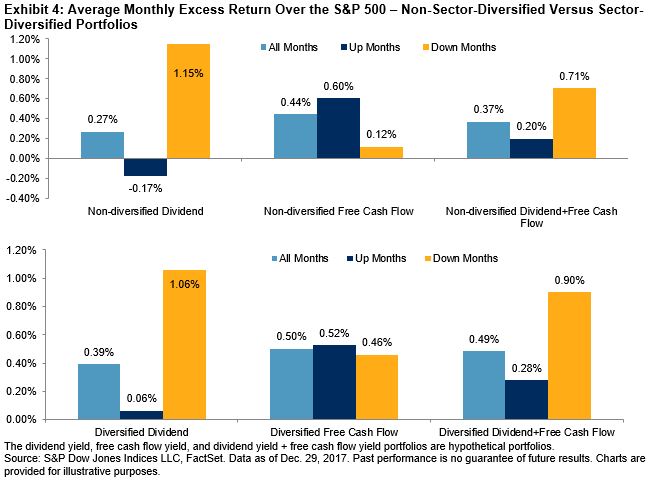
In addition to higher risk-adjusted returns, we also found that sector diversified income portfolios provided larger downside protection than the non-sector-diversified ones. Exhibit 4 highlights the monthly average excess returns of the sector-diversified and non-sector-diversified portfolios over the market, which is represented by the S&P 500. We can see that sector-diversified portfolios, on average, had higher average monthly excess returns than the non-sector-diversified portfolios in most market environments, including down markets.

Our analysis highlights the importance of sector diversification for yield-seeking market participants. Across all three strategies—dividend yield, free cash flow yield, and the combined dividend yield + free cash flow yield—sector-diversified portfolios historically demonstrated higher risk-adjusted returns than the non-sector-diversified portfolios, without compromising yield.


[1]   The product of the z-scores of the dividend yield portfolio and free cash flow yield portfolio forms the aggregated score.

The posts on this blog are opinions, not advice. Please read our Disclaimers.

Proactive Fiscal Policy to Be More Proactive: Takeaways From China’s State Council Executive Meeting on July 23, 2018

Contributor Image
Jack Jiang

Senior ETF Specialist, Index and Quantitative Investment

ICBC Credit Suisse Asset Management (International) Co., Ltd.

On July 23, 2018, China’s state council executive meeting hosted by Premier Li Keqiang announced that fiscal and monetary policy will be further fine-tuned to boost domestic demand. The meeting reiterated that China will strike a balance between “easing and tightening” and keep liquidity “reasonable and sufficient.” It was also stressed that China will not resort to outright stimulus.

More tax incentives to support technology upgrading:

  • On top of 1.1 trillion yuan in reductions in levies and fees in the pipeline for 2018, the state council announced that it will further expand the promised R&D tax credit (75% of cost) from small- to medium-sized companies to all companies, which will bring additional tax cuts worth 65 billion yuan.
  • The government requested to end the refund of 113 billion yuan from the drawback of the withholding tax to the qualified enterprises in advanced manufacturing and modern service industry.
  • The state council also requested an acceleration of the issuance of 1.35 trillion yuan of special local bonds and funds for infrastructure projects.

Prudent monetary policy to keep sufficient liquidity:

  • Keeping an appropriate total social fund, “reasonable and sufficient” liquidity, and a smooth capital transition mechanism were stressed.
  • The government requested the implementation of various incentives to small- and micro-enterprises (SME). Financial institutions were instructed to support SME and the initiative of the debt-to-equity swap by specific funds with RRR reduction. China also encouraged commercial banks to issue financial bonds for SME, waiving the requirement of the issuer’s consecutive profit.
  • The meeting also set up the target to increase the 140 billion yuan loan to around 150 thousand for SME every year.

Faster investment growth:

  • The government boosted private investment in transport, oil and gas, and telecommunications projects.
  • The statement also seeks to guide financial institutions to guarantee reasonable funding to Local Government Financing Vehicles so that essential projects aren’t held up to facilitate construction and planning of a number of large-scale projects that will meet development purposes and public demand.

Furthermore, clearing “zombie enterprises” and related invalid capital were also mentioned.

In general, the Chinese government stepped up the effort to support growth, confirming the move from consolidation to a more neutral stance amid the economic headwinds. It seemed like Chinese financial markets were recovering an appetite for risk not seen in months, taking cues from the government’s push to invigorate the economy. We have seen a 2.8% rally of the S&P China 500 in the first three days of the week.

Given the 726 billion yuan deficit in the first half of 2018 versus around 2.38 trillion yuan as the budgeted full-year deficit (2.6% of 2018 GDP), together with 5 trillion yuan in fiscal deposits and robust land sales revenue, there is still ample room for further fiscal easing.

As for the monetary policy, below-target inflation and a stabilizing debt mean that the government can afford to further lower the RRR. This can increase lending funds to facilitate corporate development. Market players expect additional cuts of the RRR rate in the second half of 2018.


Sources:

The State Council of the People’s Republic of China, July 24, 2018, http://www.gov.cn/xinwen/2018-07/24/content_5308679.htm

Bloomberg, July 23, 2018, https://www.bloomberg.com/news/articles/2018-07-23/china-says-monetary-policy-will-balance-easing-and-tightening

Reuters, July 23, 2018, https://www.reuters.com/article/us-china-economy-policy/china-eyes-more-vigorous-fiscal-policy-short-of-strong-stimulus-idUSKBN1KD1AE

Reuters, July 24, 2018, https://www.reuters.com/article/us-china-economy-policy-breakingviews/breakingviews-chinas-fiscal-nudge-betrays-growth-jitters-idUSKBN1KE0BY


DISCLAIMERS

This communication is confidential, is for informational purposes and is only for the intended recipients. It is not intended as an offer, investment advice or solicitation for the purchase or sale of any financial instrument or as an official confirmation of any transaction.  Some of the information contained herein including any expression of opinion, forecast, market prices or data has been obtained from or is based on sources believed by us to be reliable as at the date it is made, are subject to change without notice but is not guaranteed.  ICBC Credit Suisse, its subsidiaries and affiliates (collectively, “ICBCCS”) do not warrant nor do ICBCCS accept liability as to adequacy, accuracy, reliability or completeness of such information.

This transmission may contain information that is proprietary, privileged, confidential, and/or exempt from disclosure under applicable law. If you are not the intended recipient, you are hereby notified that any disclosure, copying, distribution, or use of the information contained herein (including any reliance thereon) is STRICTLY PROHIBITED. If you received this transmission in error, please immediately contact the sender and destroy the material in its entirety, whether in electronic or hard copy format. Although this transmission and any attachments are believed to be free of any virus or other defect that might affect any computer system into which it is received and opened, it is the responsibility of the recipient to ensure that it is virus free and no responsibility is accepted by ICBCCS for any loss or damage arising in any way from its use. Please note that any electronic communication that is conducted within or through ICBCCS’s systems is subject to interception, monitoring, review, retention and external production; may be stored or otherwise processed in countries other than the country in which you are located; and will be treated in accordance with ICBCCS’s policies and applicable laws and regulations.

The posts on this blog are opinions, not advice. Please read our Disclaimers.

Why is the GICS Telecommunications Sector Becoming the Communication Services Sector?

Contributor Image
David Blitzer

Former Managing Director and Chairman of the Index Committee

S&P Dow Jones Indices

With the number of telecom companies shrinking, it is clear that communications is much bigger than telecom – Communication Services includes any content delivered on networks.  The old Telecommunications Sector was vanishing because it was missing new and popular ways people communicate now.

GICS – the Global Industry Classification Standard – is widely used to define sectors and industries in indices. The GICS structure of 11 sectors will be updated in September with a new Communication Services Sector combining the existing Telecommunications Sector with parts of the Information Technology and Consumer Discretionary sectors.  The new sector encompasses companies in these areas:

  • Networks — internet, broadband, cellular, broadcast, cable and land lines
  • Content – information, advertising, entertainment, news, social media

Communication is essential in a modern economy.  Without it, the economy would be a series of small isolated villages each trying to be self-sufficient.  With it, information is shared, companies specialize, and trade flourishes.

The content of communications used to be spread across different industries and delivery networks.   Today, interconnected networks deliver virtually any content to any device over any network: text, voice and video via wired, wireless or the internet, television via broadband, newspapers read via smart phones, movies via streaming while social interactions and media follow people everywhere.  Content is crucial for commerce, business, finance, securities trading, and people.

The development that created communication services is the interconnection and sharing of content on networks.

Communication Services is the young sector…

Many communication services companies are young.  Using the dates when companies in the S&P 500 IPO’ed, we can get a sense of how old companies in various GICS sectors are. Companies have been grouped into those that became public before 1973, those listing between 1973 and 1999, and those that IPO’ed this century.  Specific dates were not obtained for the pre-1973 group. Moreover, some mergers and corporate actions obscure the dates. For example, AT&T has a date of 1984; it was created as one of the “Baby Bells” when the original AT&T was broken up in 1984. The original AT&T was incorporated in 1877. The chart shows the proportion of companies in each sector by age group. Communication Services on the left-hand side has the largest green – young – bar of any sector. Utilities, at the right, is the oldest sector. Real Estate includes REITs.  REITs were not listed on the markets in large numbers until the 1970s, explaining the large portion in “middle age.”

Communication Services is clearly the youngest sector due to social media giants like Alphabet (Google) and Facebook. Technology is now the second youngest and dominates the 1973-99 period when Microsoft and Apple came of age. Industrials, Materials, Energy and Consumer Staples represent growth of the US economy during the first three-quarters of the last century.

The relative youth of Communication Services can be a challenge for security analysts. About 60% of the market capitalization of the sector has less than 20 years of history with little data to track performance over market cycles or to reliably classify stocks by factor. While some companies in the sector IPO’ed before 1973 and a few date back to the first half of the 20th century or earlier, the sector is still experiencing rapid changes.

But Communication Services Didn’t Appear Yesterday

We take communications for granted, acting as though smart phones and the web always existed. However, today’s communication networks weren’t always here; they developed in R&D labs and garages as technology and the economy developed and matured. The table shows how the elements of today’s communication networks moved from the laboratory to commercialization.

The growth of interlinked networks bringing virtually all content together and delivering anything to anyone anywhere is changing the way we view the stock market and driving merger activity. Verizon and AT&T – the bulwark of the old Telecommunication Services Sector – own Yahoo and Time Warner. Comcast owns NBC-Universal while competing with AT&T and Verizon by selling phone service. Slightly over half of smart phones in the US operate with Android. Google and Facebook capture a quarter of global spending on advertising.

Communication services are as important in the stock market as in the economy.  To track these developments in networking and content, GICS is introducing the Communication Services Sector by combining networks and content from the Telecommunications, Information Technology and Consumer Discretionary sectors. The old Telecommunication Services Sector disappears.

The posts on this blog are opinions, not advice. Please read our Disclaimers.

Responsible Investor Europe 2018 Conference: What to Watch for in the Remainder of 2018 and 2019

Contributor Image
Kelly Tang

Former Director

Global Research & Design

In a prior blog, we highlighted that the recent Responsible Investor Europe Conference 2018 gave attendees the sense of a coming of age in the environmental, social, and governance (ESG) movement that could potentially portend a future filled with a greater sense of urgency and call for action in the sustainability world. As noted previously, the drivers behind this heightened sense of urgency stem from a changing political climate that could be potentially less favorable for global ESG issues, the Taskforce on Climate-related Financial Disclosures (TCFD) recommendations on disclosure implementation, and landmark legislative proposals that have been put forth by the European Commission.[1]

The question then arises: What does this call for urgency and action mean for future developments in ESG investing? Here we identify several key themes that we believe will garner more attention in the coming months, extending well into 2019.

  1. Proliferation in ESG-driven investment products on the active and passive fronts to satisfy growing demand, especially from Millennials: The compound annual growth rate (CAGR) of ESG-specific assets rose 23% from 2014 to 2016, compared with the industry average CAGR of 5%.[2] To meet this continued demand, there will be more ESG-related investment products coming to market, as product sponsors continue to build out and extend their suite of ESG offerings.[3] While many products will incorporate standard ESG exclusions, market participants should also expect to see indices and products that incorporate more forward-looking data that follow TCFD recommendations. The Church of England’s Pension Board also announced plans to develop its own index backed by the Transition Pathway Initiative’s analysis of 105 of the world’s largest and highest-emitting public companies across the coal mining, electricity, and oil & gas industries.[4]
  2. S-related issues will continue to be at the forefront: According to a new paper released by the Harvard Kennedy School, “Money, Millennials and Human Rights: Sustaining ‘Sustainable Investing’,” the S in ESG investing is “by far the weakest” element, and the S subcomponent yields the lowest correlation in a comparison of S scores across different rating providers. It recommends that the United Nations Guiding Principles on Business and Human Rights serve as the basis of what analysts, rating providers, and investors measure when it comes to the S aspect. The paper cites an NYU study that revealed that only 12% of S-ratings products target investors as the primary audience, versus 97% and 80% of E- and G-ratings-based products, respectively. Owing to this void in the market, we expect to see more S-related investment products coming to market.
  3. More research on ESG and materiality in a push to classify ESG indicators from “non-financial” to “extra-financial”: In order to integrate ESG factors into the financial analysis process, there will have to be a rethink in the financial industry, leading to a mind shift in classifying ESG information away from the term “non-financial,” which has negatively affected ESG adoption by analysts and portfolio managers in the past. In order to get to the goal of greater acceptance, there will need to be more continued in-depth research examining ESG and materiality. The classification of ESG data as “non-financial” can evolve and take on more significant financial interest to investors and become more aptly “extra-financial.”

There is ample evidence that the three trends are already starting to take shape, with more product sponsors filing for ESG-related investment products. Going into the second half of 2018 and into 2019, we are confident that the above trends will come to fruition, as ESG participants feel the pressure to integrate and implement ESG strategies as it transitions to the mainstream.

[1]   The European Commission has confirmed its first four legislative proposals to spur sustainable finance in the region, covering green definitions and taxonomy, investor duties, retail investing, and benchmarks. In reference to the fourth pillar, the European Commission plans to use a delegated act to create a new category of benchmarks focused on climate mitigation. The first will be a conventional low-carbon benchmark, which will serve to “decarbonize standard benchmarks” by selecting stocks with lower emissions. For those investors that want to be 2 degrees Celsius compliant, the second benchmark—which is described as “impact” focused—will be more ambitious and will seek to meet the Paris Agreement whereby a company’s carbon savings outstrip its carbon emissions. European Commission: Press Release Database “Sustainable finance: Making the financial sector a powerful actor in fighting climate change.” May 24, 2018.

[2]   Kim, Crystal. “Could ESG Become the Wrapper for All Investing?” Barron’s. June 23, 2018

[3]   Vanguard recently announced that it had filed for two ESG exchange traded funds (ETFs)—the Vanguard ESG U.S. Stock ETF and Vanguard ESG International Stock ETF. These indices will exclude controversial industries such as weapons, fossil fuels, etc., in addition to incorporating additional screening for criteria such as diversity, human rights, and anti-corruption. Vanguard. “Vanguard Files For Two New ESG ETFs.” June 27, 2018.

[4]   The Church of England. “Archbishop of Canterbury’s comments at Transition Pathway Initiative summit.” July 2, 2018.

The posts on this blog are opinions, not advice. Please read our Disclaimers.

Trading in Facebook Shows Indexing Has Little to Do With Valuation-Based Dislocations

Contributor Image
Philip Murphy

Former Managing Director, Global Head of Index Governance

S&P Dow Jones Indices

By the close of trading on Thursday, July 26, 2018, shares in Facebook (FB) traded down almost $99 billion, or 19% of their market value. Despite FB’s beginning weight of 2.16%, the S&P 500® was almost flat, losing 0.30% on the day. I suspect you will not hear much about this from those who attempt to create an association between indexing and bubble building. However, for those looking to understand the market, as well as potential changes brought on through the adoption of indexing as an investment strategy, yesterday’s trading in FB shares offered several things to think about.

At the close of July 25, 2018, the S&P 500 included 2,398,606,000 FB shares, substantially all of the company’s shares outstanding. Their value of $217.50 each gave FB a market value of $521.7 billion. At the close of July 26, 2018, the S&P 500 still included the same 2,398,606,000 FB shares. The index did not “sell”, or “drop” in index parlance, one share of FB stock. Nevertheless, by the close of trading, FB was valued at $176.26 per share, or about $422.8 billion for the whole company.

On July 26, 2018, index funds that track the S&P 500 would have no need to sell FB shares, unless they were managing cash flows out of their funds. However, if they were engaging in such trading, they would likely sell proportionate amounts of all stocks in the S&P 500, not only FB. Therefore, if index funds were predominantly responsible for the dislocation in FB shares, the overall market would have sold off to a similar extent.

After the fact, some may draw the conclusion that FB was overvalued. While possibly true, it would not be the most helpful lesson to draw. When the company warned about slowing revenue and contracting margins, it was new information for shareholders to digest. If investors had overvalued the shares on their way up, it was not because of cap-weighted index funds. Those who estimate company value had been overly optimistic and needed to correct their forward-looking assumptions. In other words, active investors set the share price. Investing in market cap-weighted index funds does not create valuation dislocations in individual stocks or bubbles in the market in general. The evidence lies in Facebook

The posts on this blog are opinions, not advice. Please read our Disclaimers.